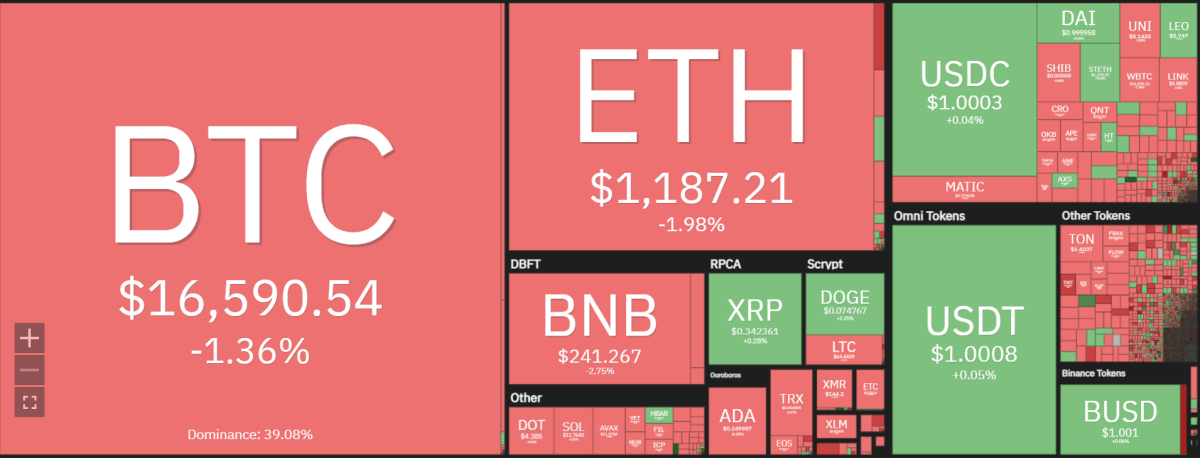
Bitcoin price analysis shows Bitcoin has failed to make a decisive break above $17,000 and has since fallen back below $16,800. This could be indicative of a bearish trend developing as investors take profits from their positions. The primary reason for the retracement appears to be profit-taking due to the significant price appreciation in recent weeks. Bitcoin had become overextended and a correction was in order. Bitcoin is trading at $16,673.16, down by 0.82 percent in the last 24 hours.

The next area of support appears to be $16,000 – a level that has been held in the past. If this key level fails to hold then prices could potentially test $15,000 before finding support. On the upside, there is resistance at $17,000 which must be breached for Bitcoin to make any further gains.
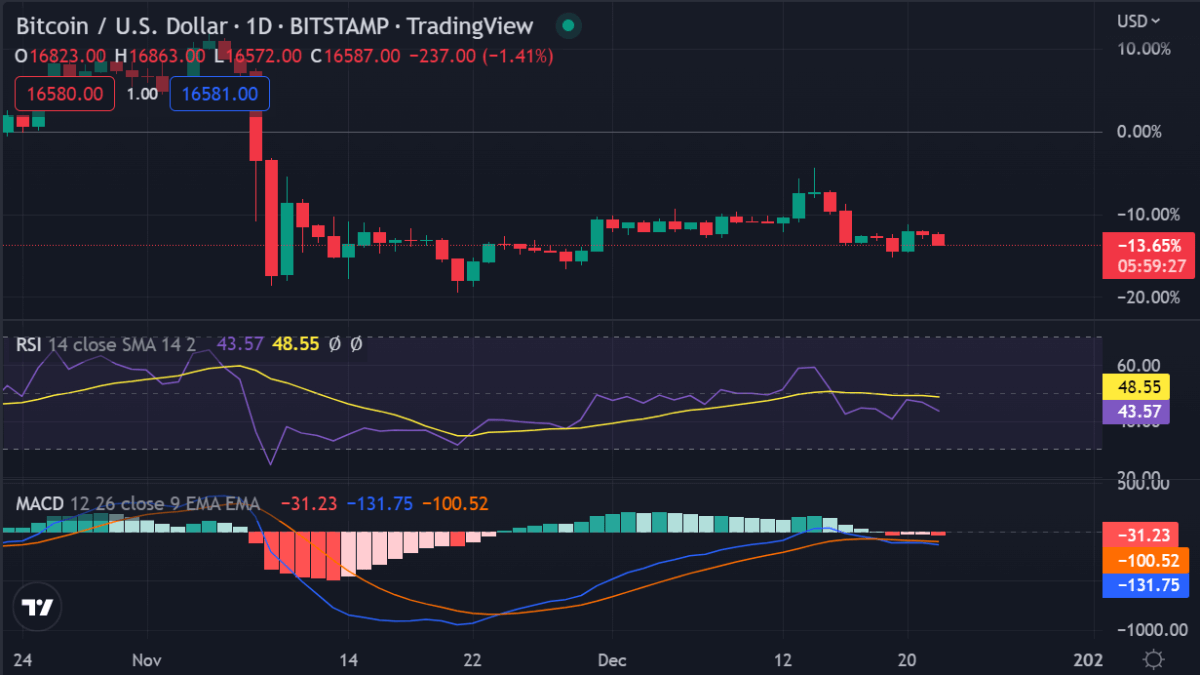
Bitcoin price analysis on a daily chart: BTC remains dormant below the $17,000 resistance level
On the daily timeframe, Bitcoin price analysis reveals BTC has been trading in a dormant state in recent days. It failed to break above the $17,000 resistance level and has since fallen back to the $16,800 region. Bitcoin’s retracement levels suggest a downside move to the $16,000 support level is likely in the near term. If Bitcoin continues to struggle with this resistance then it may be due for further losses.

The MACD and RSI both indicate that bearish momentum is building, and a break below $16K could signal a deeper retracement. Bitcoin price action in the last 24 hours has been relatively muted and it looks like this period of consolidation is set to continue.
The Fibonacci retracement tool shows the key levels of support and resistance. The most important one is the 61.8% Fibonacci level which is currently at $16,400 – any break below this could potentially trigger significant losses as traders take profits.
The moving averages are also indicating a bearish trend. The 50-period moving average is now below the 200-period one, suggesting that Bitcoin could drop lower in the coming days.
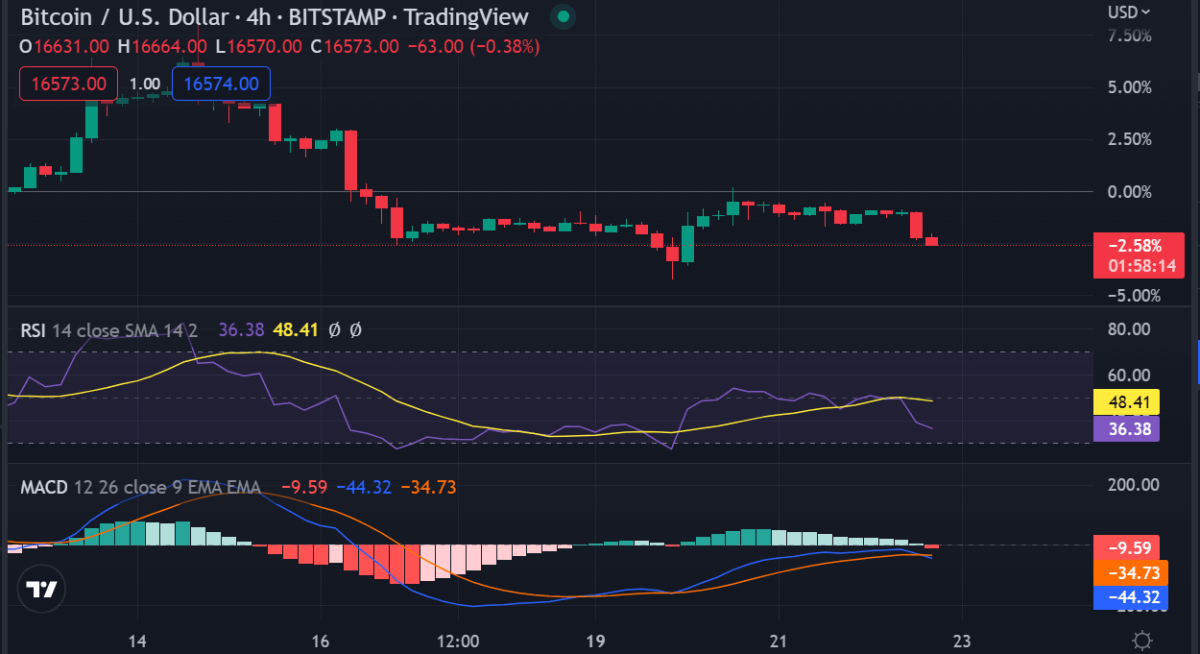
Bitcoin price analysis on a 4-hour chart: Bitcoin stumbles at $16,500 support
The 4-hour chart reveals Bitcoin is struggling to stay above the $16,800 mark. The MACD shows a bearish crossover, suggesting bearish momentum could be gaining strength in the short term. The RSI is also trending lower and indicating that more downside could follow if these levels break.

At the same time, Bitcoin has found support at the $16,500 level which could prevent further losses. If this level is breached then the next area of support lies at $16,000 – a key psychological level. Any break below this could trigger significant losses for BTC in the near term.
Further technical indicators show the oscillators are bearish, however, the Ichimoku Cloud is still suggesting an overall bullish trend. The weekly candle is also due to close with a bullish bias, potentially setting up for a strong week ahead.
Заклучок за анализа на цената на биткоин
Bitcoin price analysis shows BTC is struggling to make a decisive break above the $17,000 resistance level and could be in for further losses if support at $16,400 fails to hold. Bitcoin’s price movement in the coming hours will be critical for determining where it goes move next. The $16,500 level could be key in terms of offering support and a bounce off this could potentially set up a bullish trend to develop. However, if Bitcoin fails to make any significant gains then further losses may follow as profit-taking intensifies.
Додека чекате Bitcoin да се движи понатаму, видете ги нашите предвидувања за цените XDC, Шарнир, и крива
Извор: https://www.cryptopolitan.com/bitcoin-price-analysis-2022-12-22/