After a short period of bullish price action and an impulsive upward rally, Bitcoin entered a consolidating stage with little momentum. Despite being rejected from a crucial resistance level, the price is showing bearish signs.
Техничка анализа
By Шајан
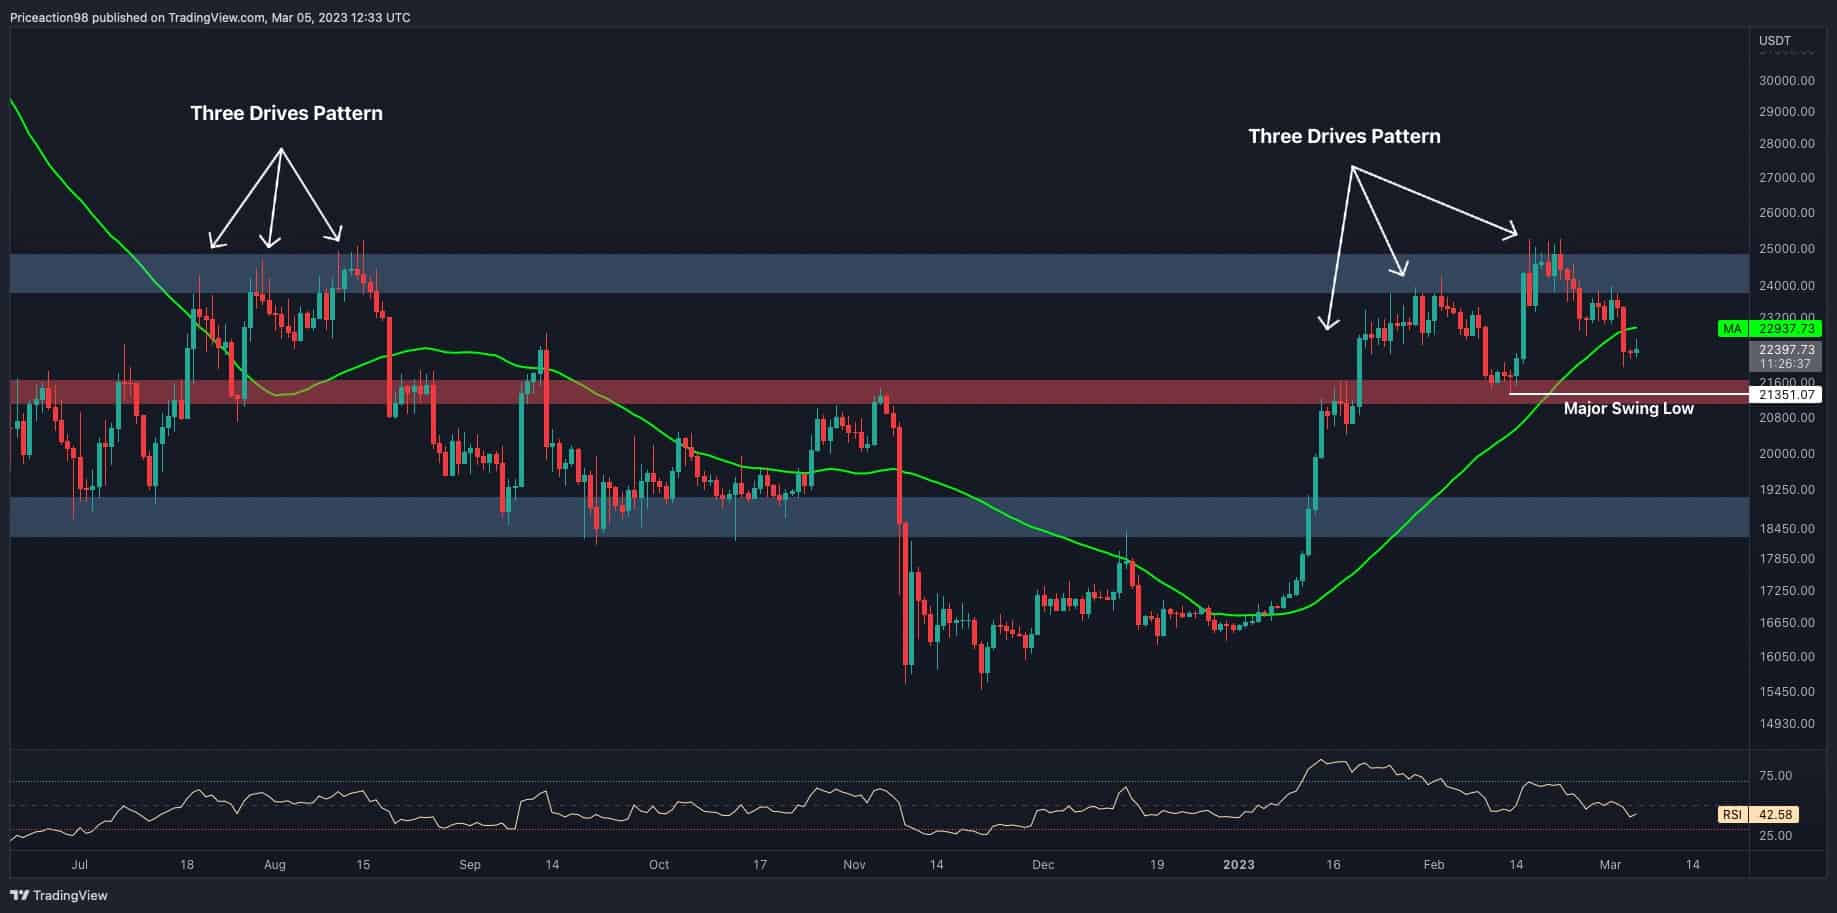
Дневниот графикон
The $25K resistance level has been a nightmare to Bitcoin investors over the last year as the price failed to rise beyond this point and was constantly rejected. Days ago, the cryptocurrency attempted to surpass this crucial level and experienced a significant drop.
The price has formed an ascending three drives pattern, a well-known bearish reversal pattern, at the $25K resistance region. The same pattern can be seen back in August when BTC was trying to push above this strong resistance, leading to a massive rejection and an impulsive decline.

Bitcoin has also dropped below the 50-day moving average, delivering a general bearish bias for the cryptocurrency. If the plummet continues and Bitcoin breaks below its prior major swing, a bearish rally toward the critical $18K support will become more likely.
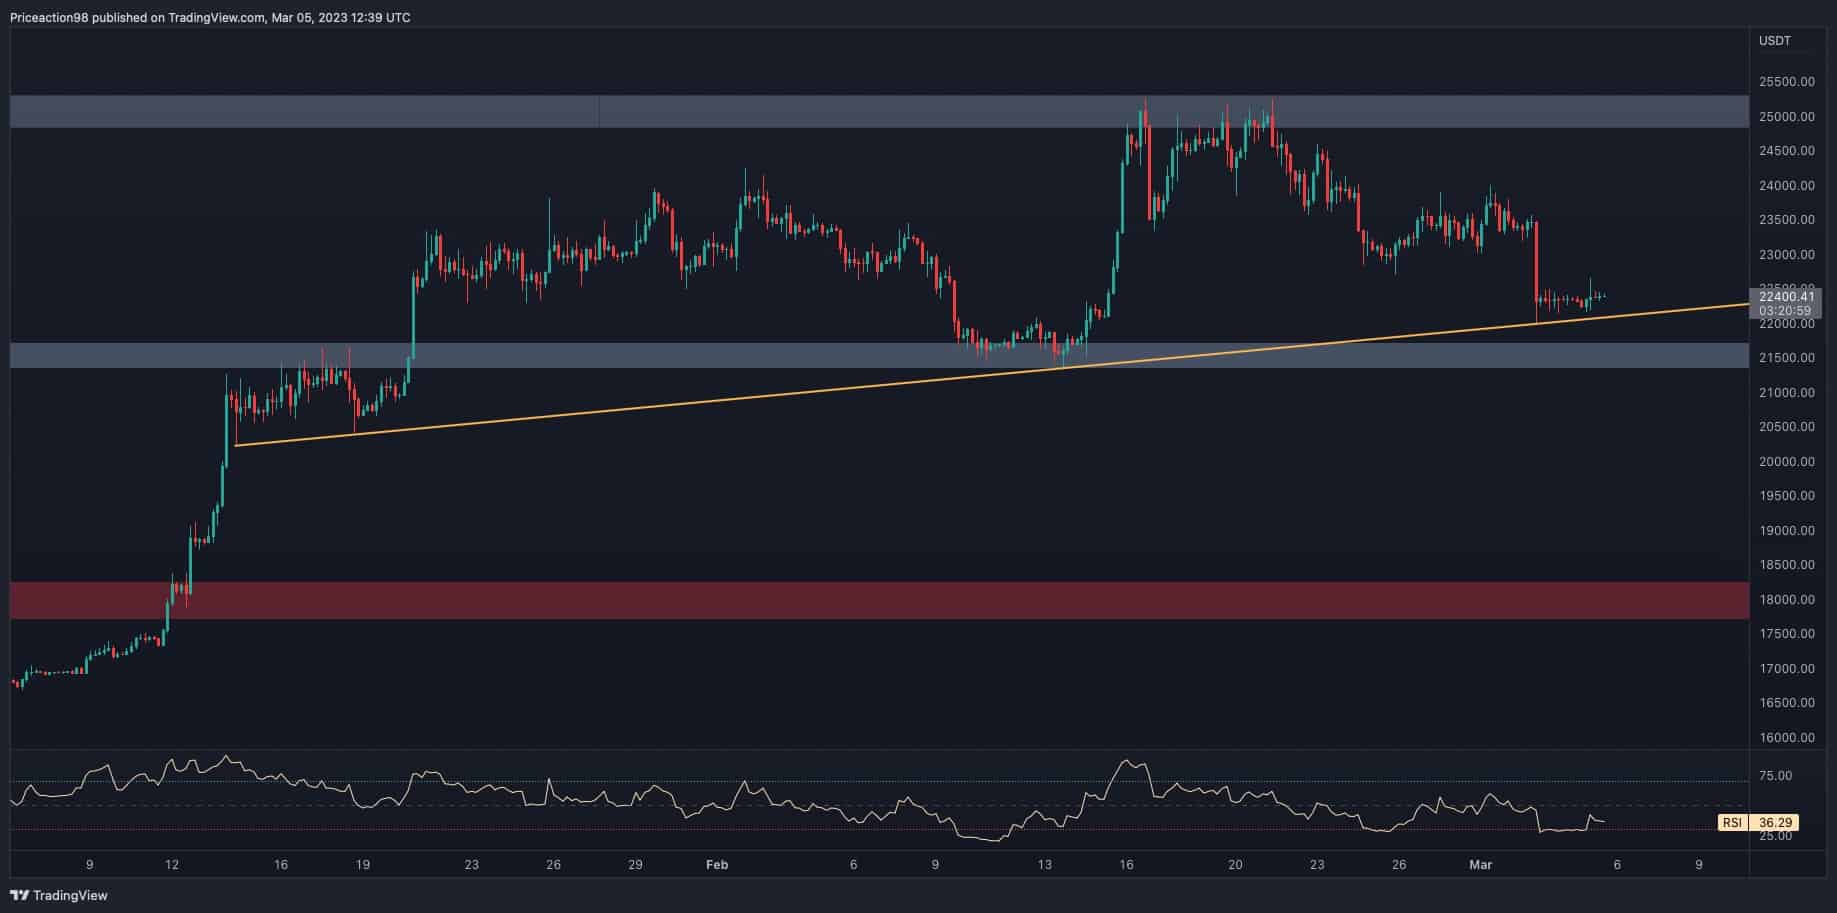
Табела од 4 часа
During the consolidation stage of the market, Bitcoin has formed an ascending trendline, acting as support to the price. The recent Silvergate and Binance FUD has led to a significant decline, pushing the cryptocurrency down toward the ascending trendline.
Currently, BTC struggles to break down the trendline at $22.4K, consolidating with extremely low volatility.
If the trendline is broken, Bitcoin could experience a mid-term shakeout, flushing out many long positions in the futures market. Currently, the levels of support are in the $21.5K and $18K regions.
Анализа на синџир
As with any other market, Bitcoin’s price is also determined by supply and demand dynamics. When the demand surpasses the supply, the price increases and vice versa.
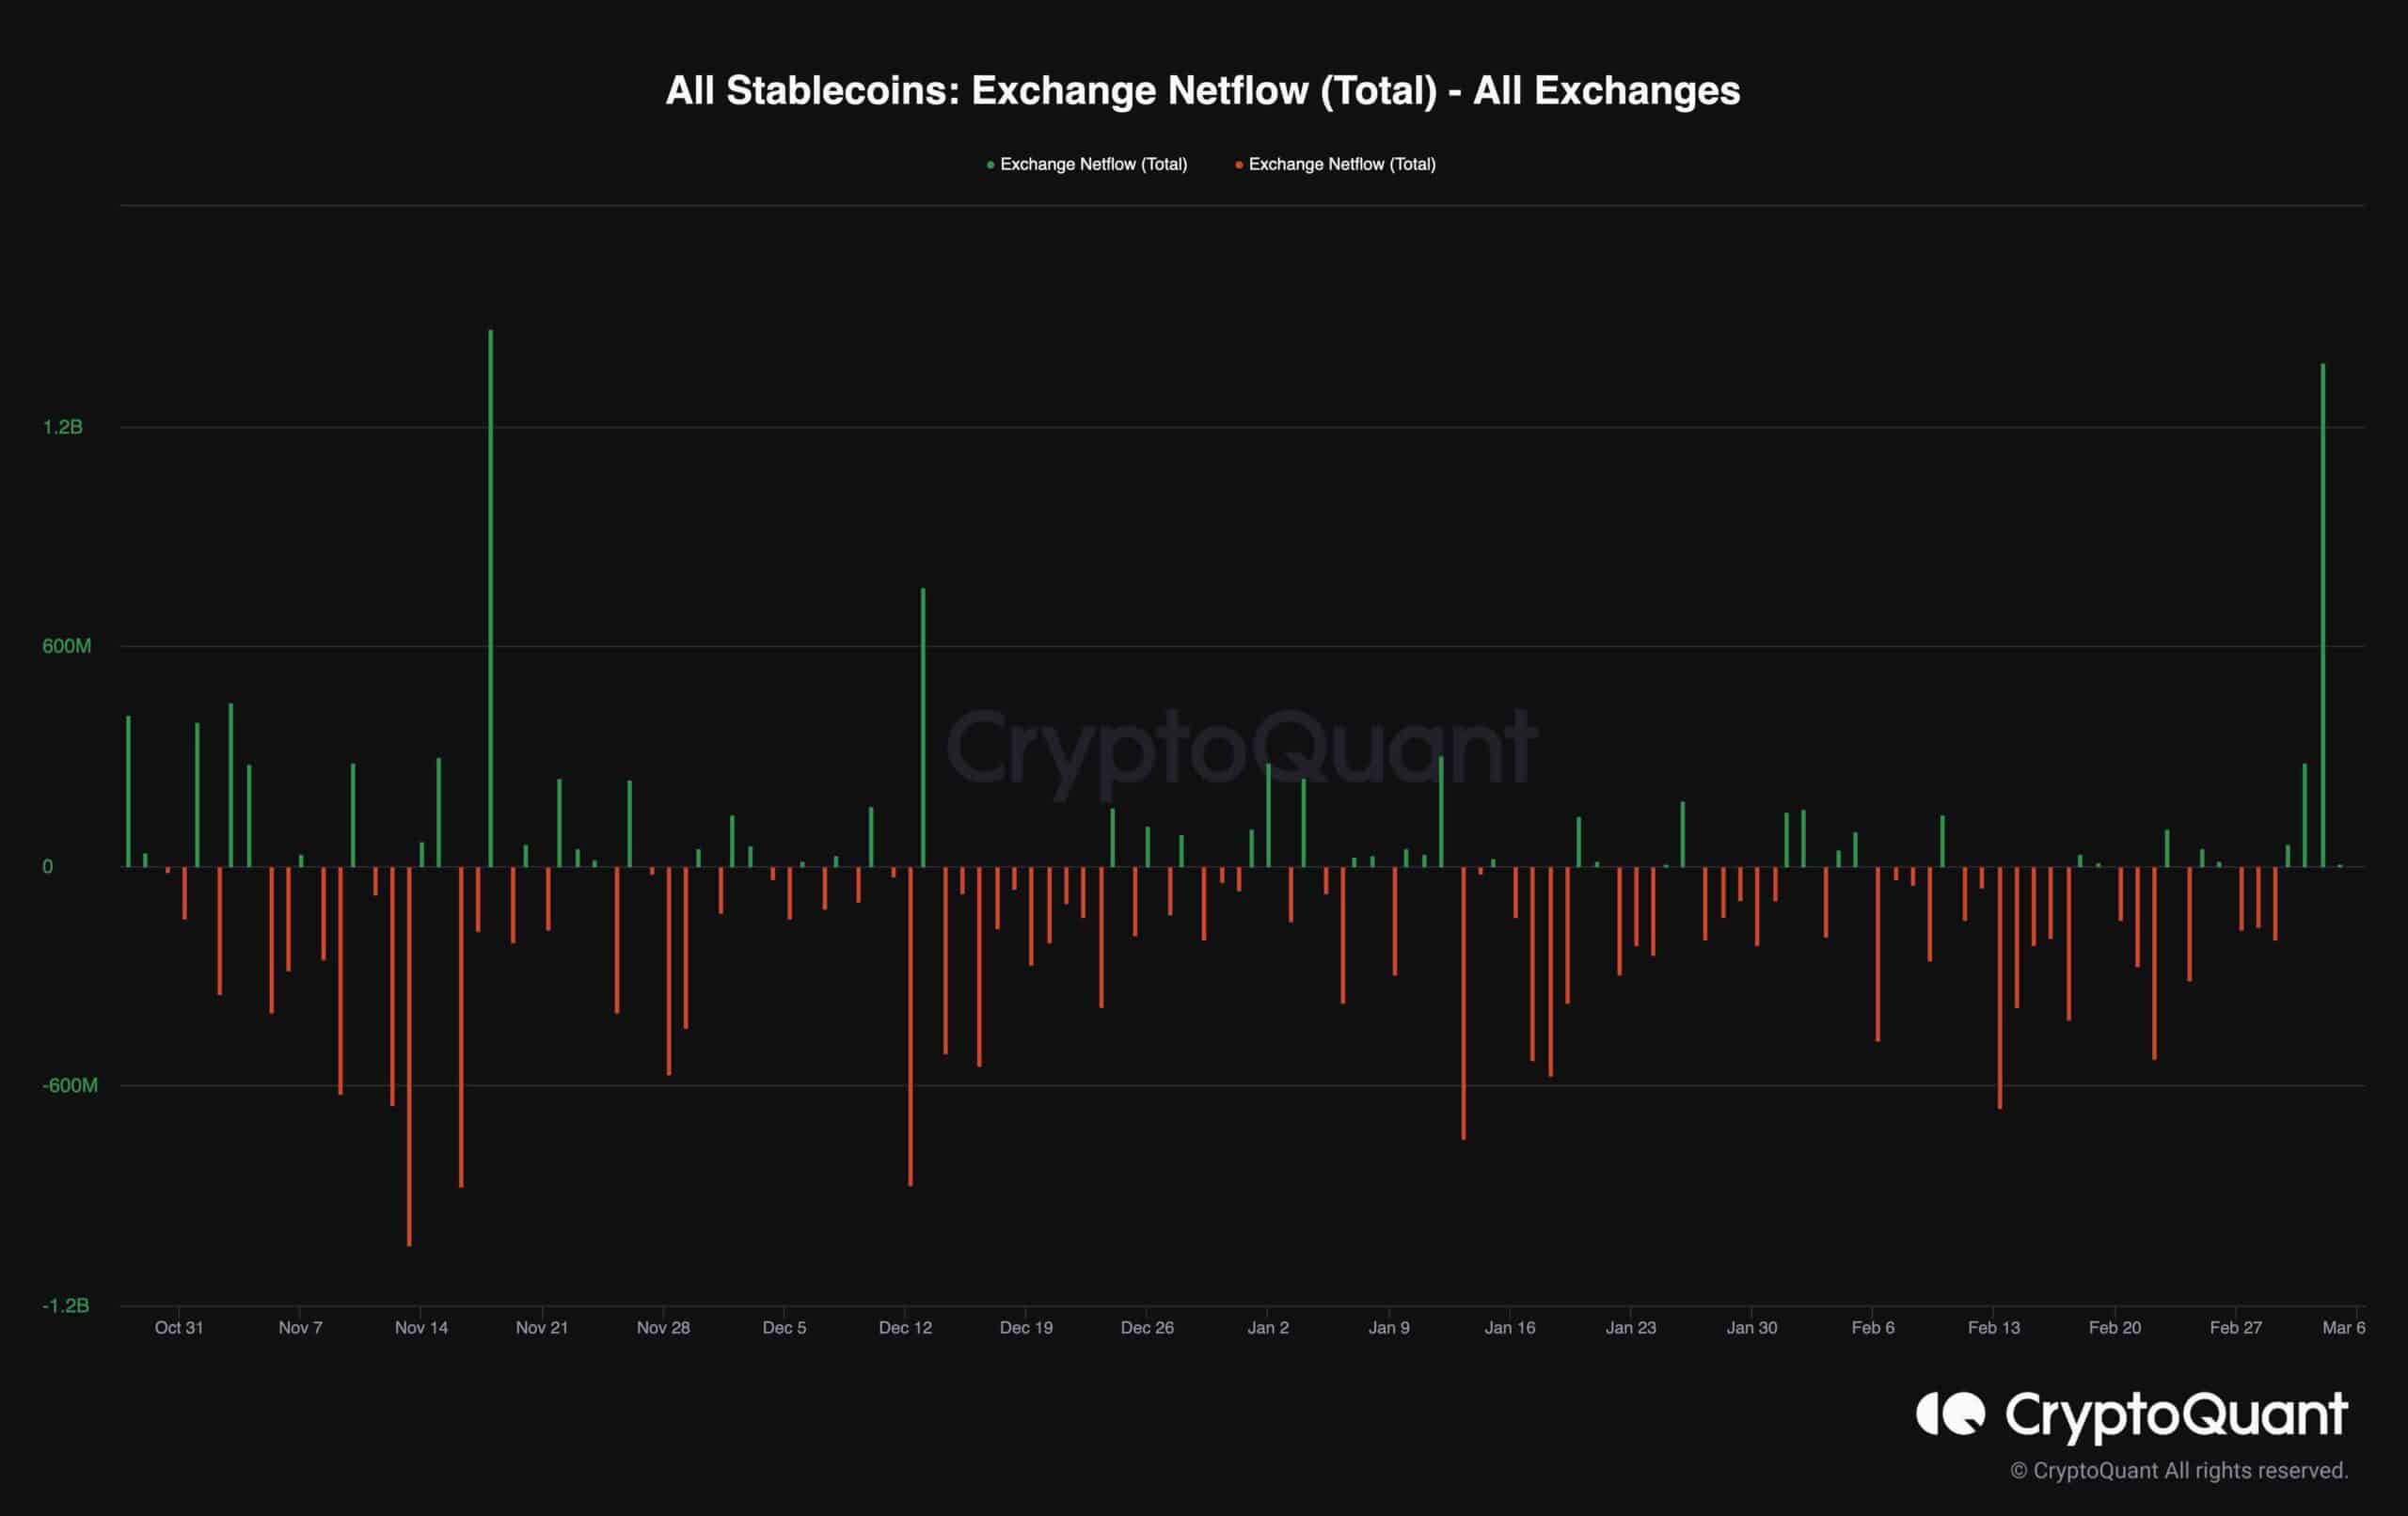
The Exchange Netflow metric for all stablecoins might be helpful to measure the possible demand for purchasing Bitcoin. When the metric spikes, it can be interpreted that participants are depositing stablecoins, possibly for the purpose of buying Bitcoin.
Recently, the metric spiked and significantly turned green, indicating that a considerable number of stablecoins have been deposited to the exchanges.
Although participants should consider each scenario to control their risks, the recent jump in the metric possibly signifies that players are ready to inject sufficient demand into the market and push the prices up when the time is right.
Binance Free 100 $ (ексклузивно): Користете ја оваа врска да се регистрирате и да добиете бесплатни $100 и 10% попуст на таксите на Binance Futures првиот месец (услови).
PrimeXBT Специјална понуда: Користете ја оваа врска да се регистрирате и да го внесете кодот POTATO50 за да добиете до 7,000 УСД на вашите депозити.
Одрекување: Информациите пронајдени на CryptoPotato се оние на цитираните писатели. Не ги претставува мислењата на CryptoPotato за тоа дали да купи, продаде или да одржи инвестиции. Ве советуваме да спроведете свое истражување пред да донесете какви било решенија за инвестирање. Користете дадени информации на ваш сопствен ризик. Погледнете Одрекување за повеќе информации.
Табели за криптовалентност од TradingView.
Source: https://cryptopotato.com/bitcoins-volume-dissipates-around-22-4k-but-is-a-massive-move-coming-btc-price-analysis/