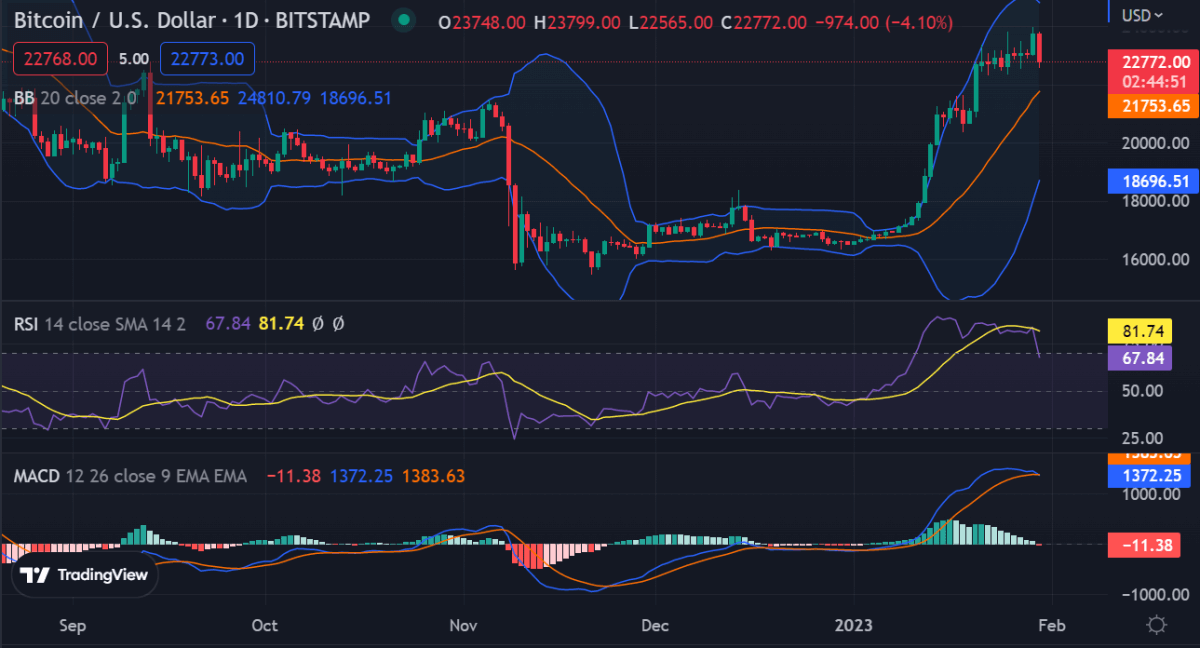
Today’s Bitcoin price analysis indicates BTC traded in a sideways price movement before the bears could take control. Bitcoin’s price reached a daily peak of $23,861.64 but has declined to $22,733.77 after failing to sustain its gains. Bitcoin’s current price is below the key support level of $23,000 which could be a sign of further downside pressure in the near term.

The next resistance level lies at $24,000 and if Bitcoin manages to break above this point then BTC may aim for higher levels. On the other hand, if BTC fails to break above $24,000 then it is likely that correction could be imminent in the near term.
Bitcoin price has been on a remarkable uptrend this month, reaching as high as $23,500. Despite the impressive gain, the market is now facing some resistance at the key psychological level of $24,000. This level has previously acted as both support and resistance for Bitcoin and if it does not break above this level soon, there is a chance of a correction in the near term.
Bitcoin price analysis on a daily chart: Bears are in control, correction imminent?
From the daily chart, Bitcoin price analysis shows BTC has broken below the descending triangle pattern which indicates that the bears are in control of Bitcoin’s price action. Moreover, a bearish cross has formed between the 50-day and 200-day moving average (MA) indicating an increasing bearish pressure on BTC.

Bitcoin’s trading volume has remained intact despite the downtrend, which could be a sign of further upside. The market volatility is high at the moment as indicated by the high Bollinger Bands (BB) width.
The Relative Strength Index is headed downwards and is falling sharply as the selling pressure intensifies. Bitcoin is down by 4.10% in the last 24 hours, a sign of bearishness in the market. The RSI is residing at 67, indicating the market has more room for the downside.
The next few days will be crucial for Bitcoin’s price action as it makes an attempt to break above $24,000. If BTC fails in its attempts and falls below this level then there is a chance of a short-term correction in the near term. The MACD indicator is on the verge of crossing below the signal line, hinting at the potential for a deeper correction.
At the same time, if BTC succeeds in breaking above the $24,000 level then it could open up a new wave of buying pressure in the market. In that case, we could see Bitcoin continuing its current uptrend and aiming for higher levels. The outlook for Bitcoin looks uncertain and it remains to be seen whether the bulls can muster enough strength to break above $24,000.
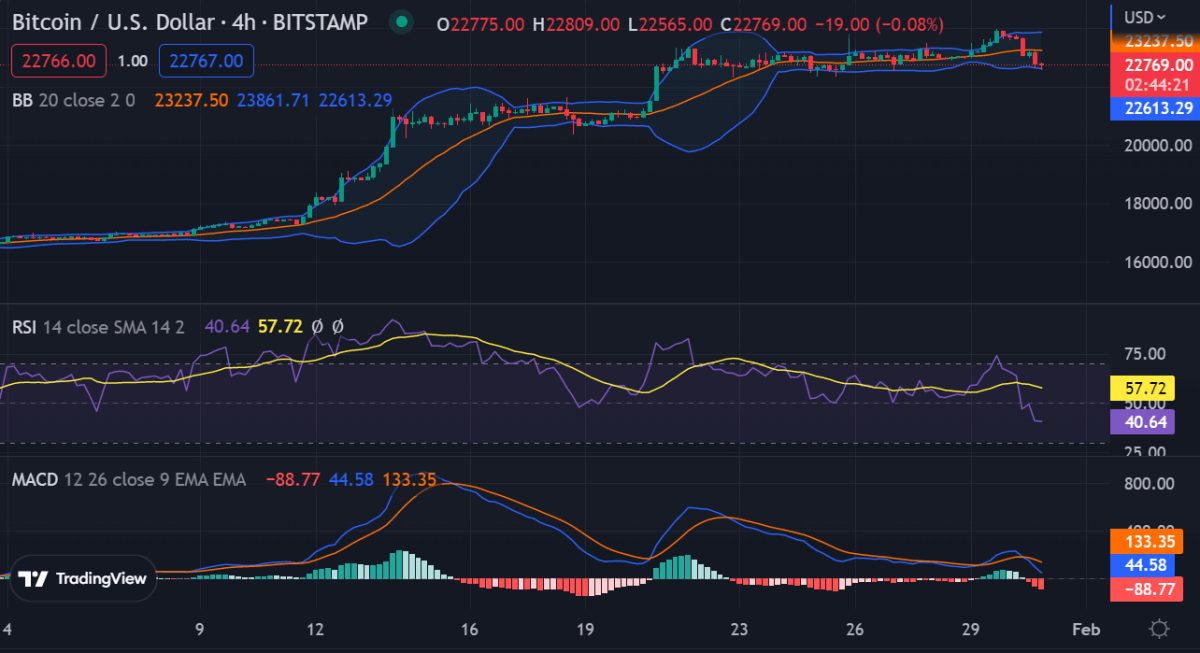
Bitcoin price analysis on a 4-hour chart: Selling pressure intensifies
From the four-hour chart, Bitcoin price analysis shows that BTC is trading in a bearish channel and has entered a descending triangle pattern. The RSI is heading downwards, indicating increasing selling pressure on Bitcoin’s price action. The MACD indicator is also headed downwards, suggesting that the bearish momentum continues to hold strong.

The EMA of 10 is below the EMA of 20, signaling that BTC could retrace further while the Chaikin Money Flow (CMF) indicator is below the zero line, suggesting that money is fleeing from BTC.
Заклучок за анализа на цената на биткоин
Bitcoin price analysis shows the current sentiment remains bearish and BTC could face further downside pressure in the near term. Bitcoin needs to break above $24,000 for any chance of bullishness but at the moment, a correction seems more likely. The next key support level lies at $22,000 and if Bitcoin breaks below this level then we could see BTC going into a deeper correction. The Fibonacci retracement level of 50% lies at $20,000 and if BTC falls below this level then it is likely that the bears have taken control of Bitcoin’s price action.
Додека чекате Bitcoin да се движи понатаму, видете ги нашите предвидувања за цените XDC, Шарнир, и крива
Извор: https://www.cryptopolitan.com/bitcoin-price-analysis-2023-01-30/
