Bitcoin’s downtrend has dwelled after a steep shakeout to $17K, which is below 2017’s all-time high level. This price range is a decisive support region for the cryptocurrency.
Техничка анализа
By Шајан
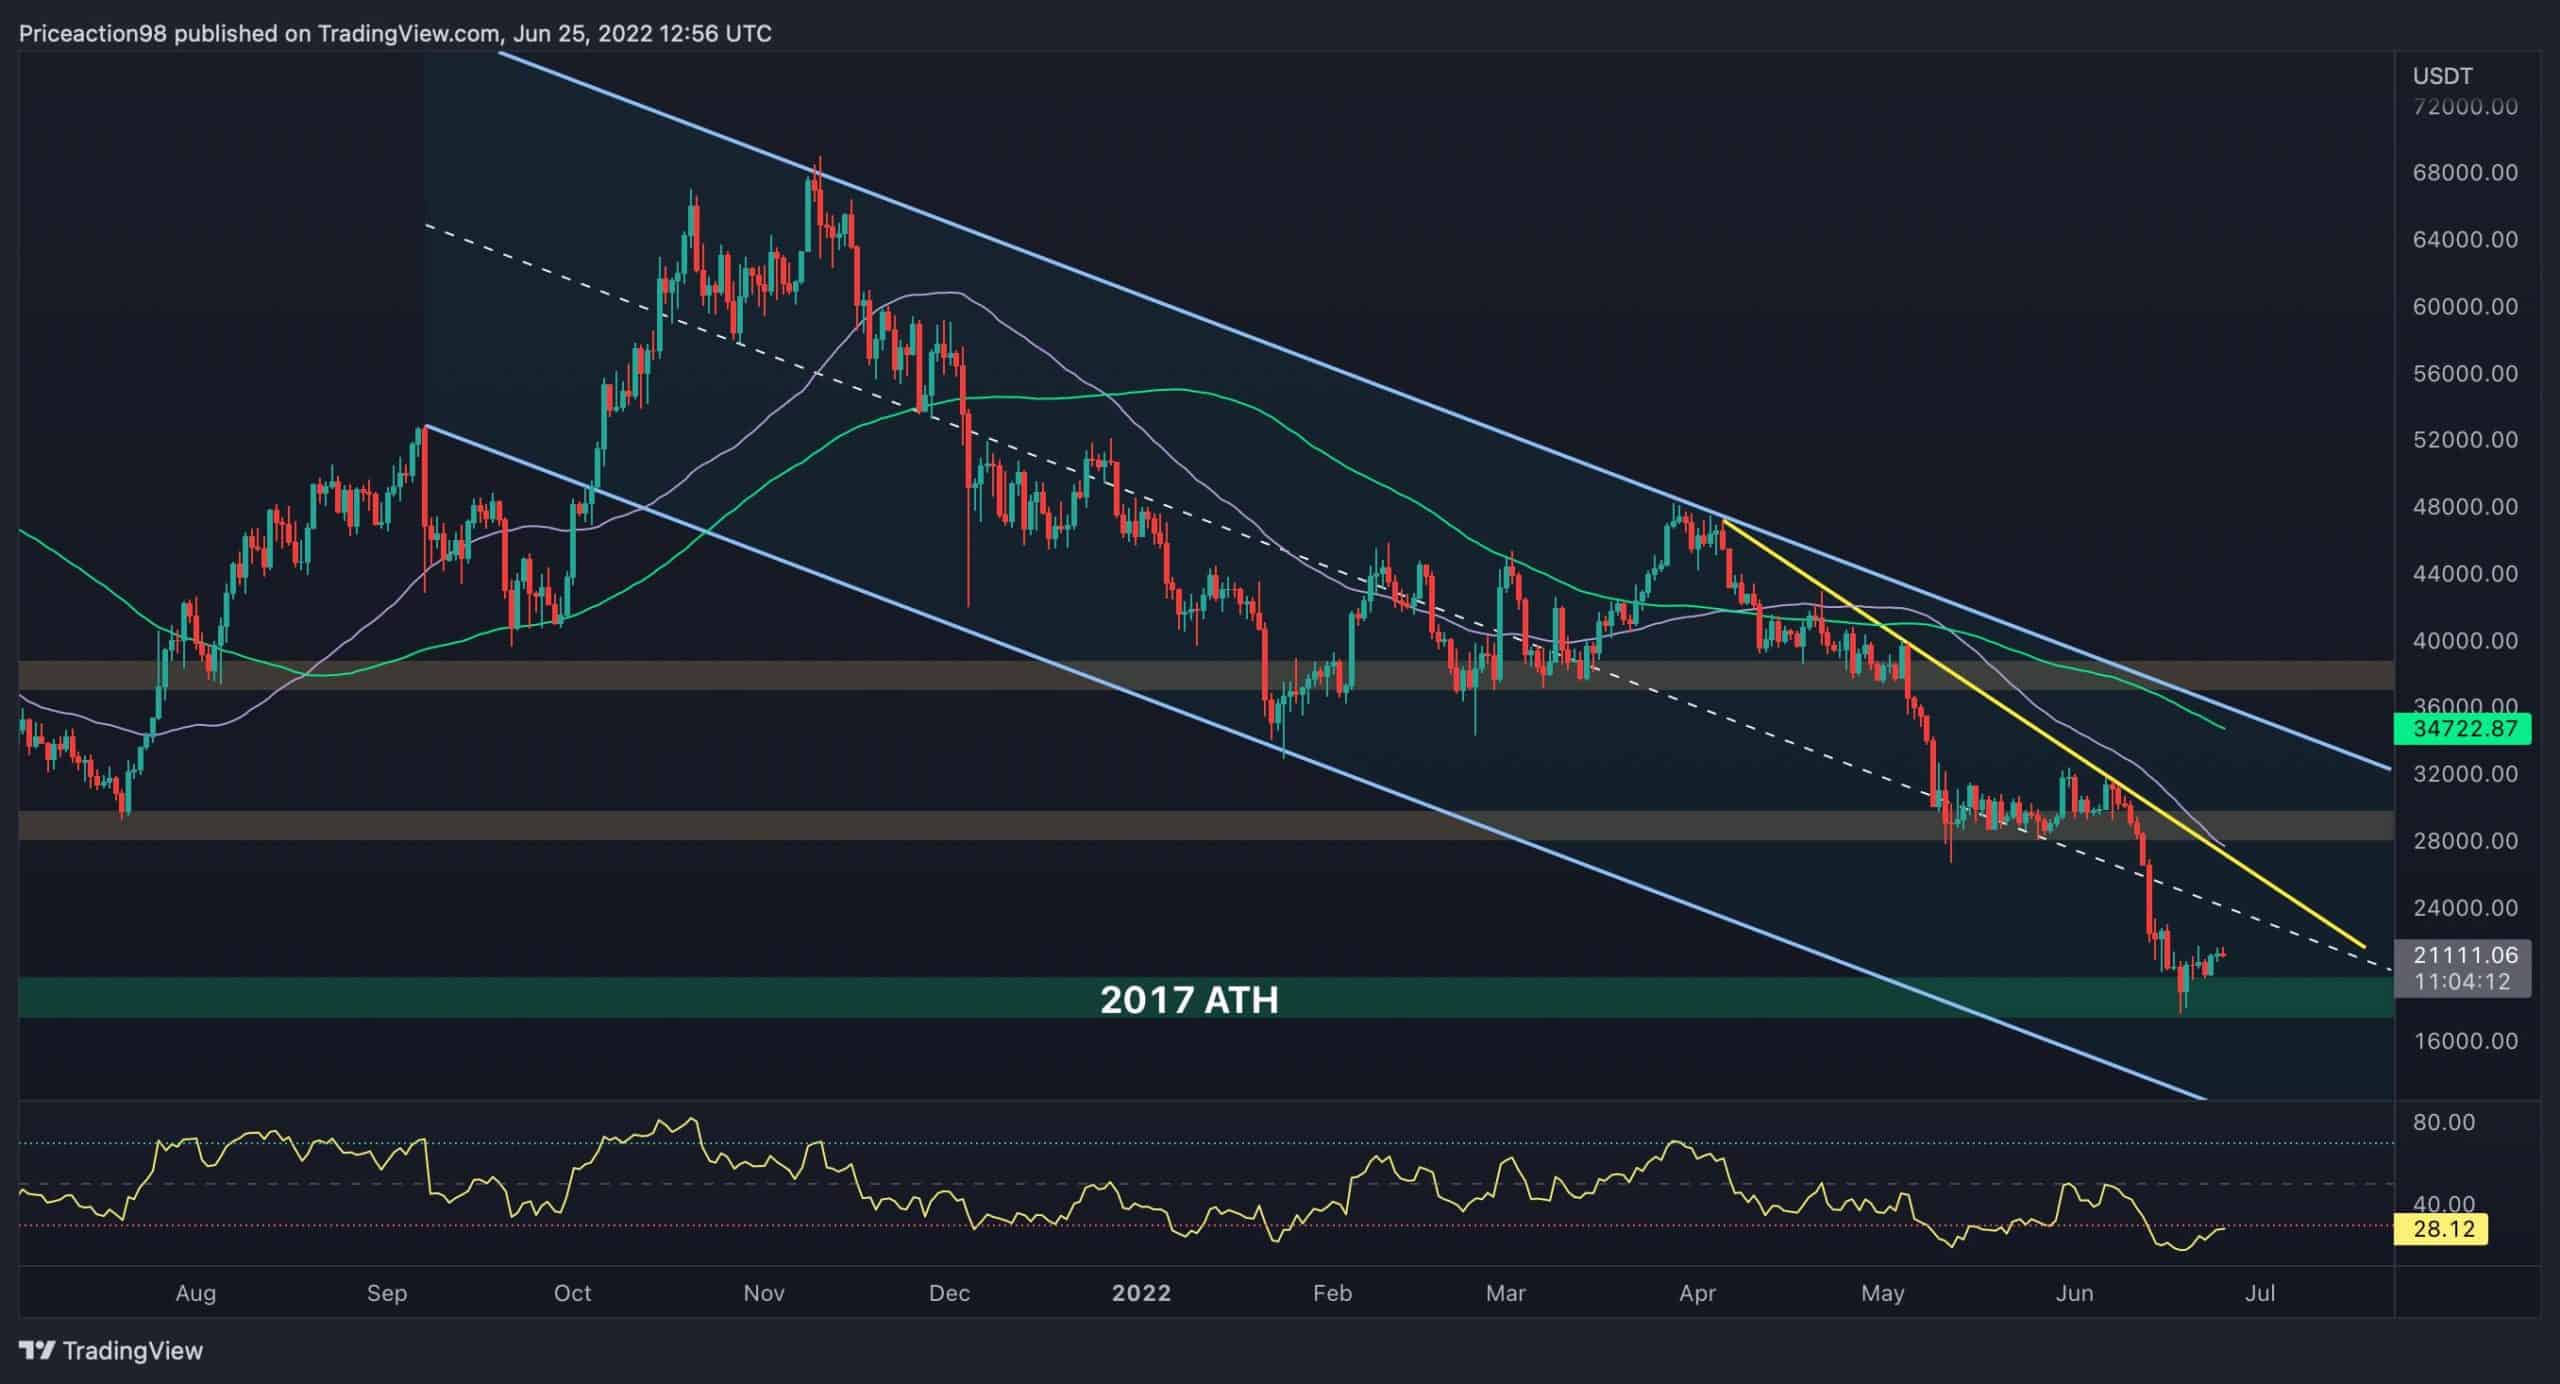
Дневниот графикон
Bitcoin’s bearish momentum has been weakened after an impulsive crash leading to a short-term consolidation. However, another sudden move to the downside might occur if the negative sentiment intensifies, driven by external forces again, pushing the market below the current support level and closer to $15K.
On the other hand, the yellow trendline has served as a mid-term resistance for the price. The trendline has recently rejected BTC, initiating the leg down to the $17K level. Nevertheless, the channel’s mid-trendline, the 50-day moving average, and the mentioned level are the main obstacles on Bitcoin’s path to higher price channels.

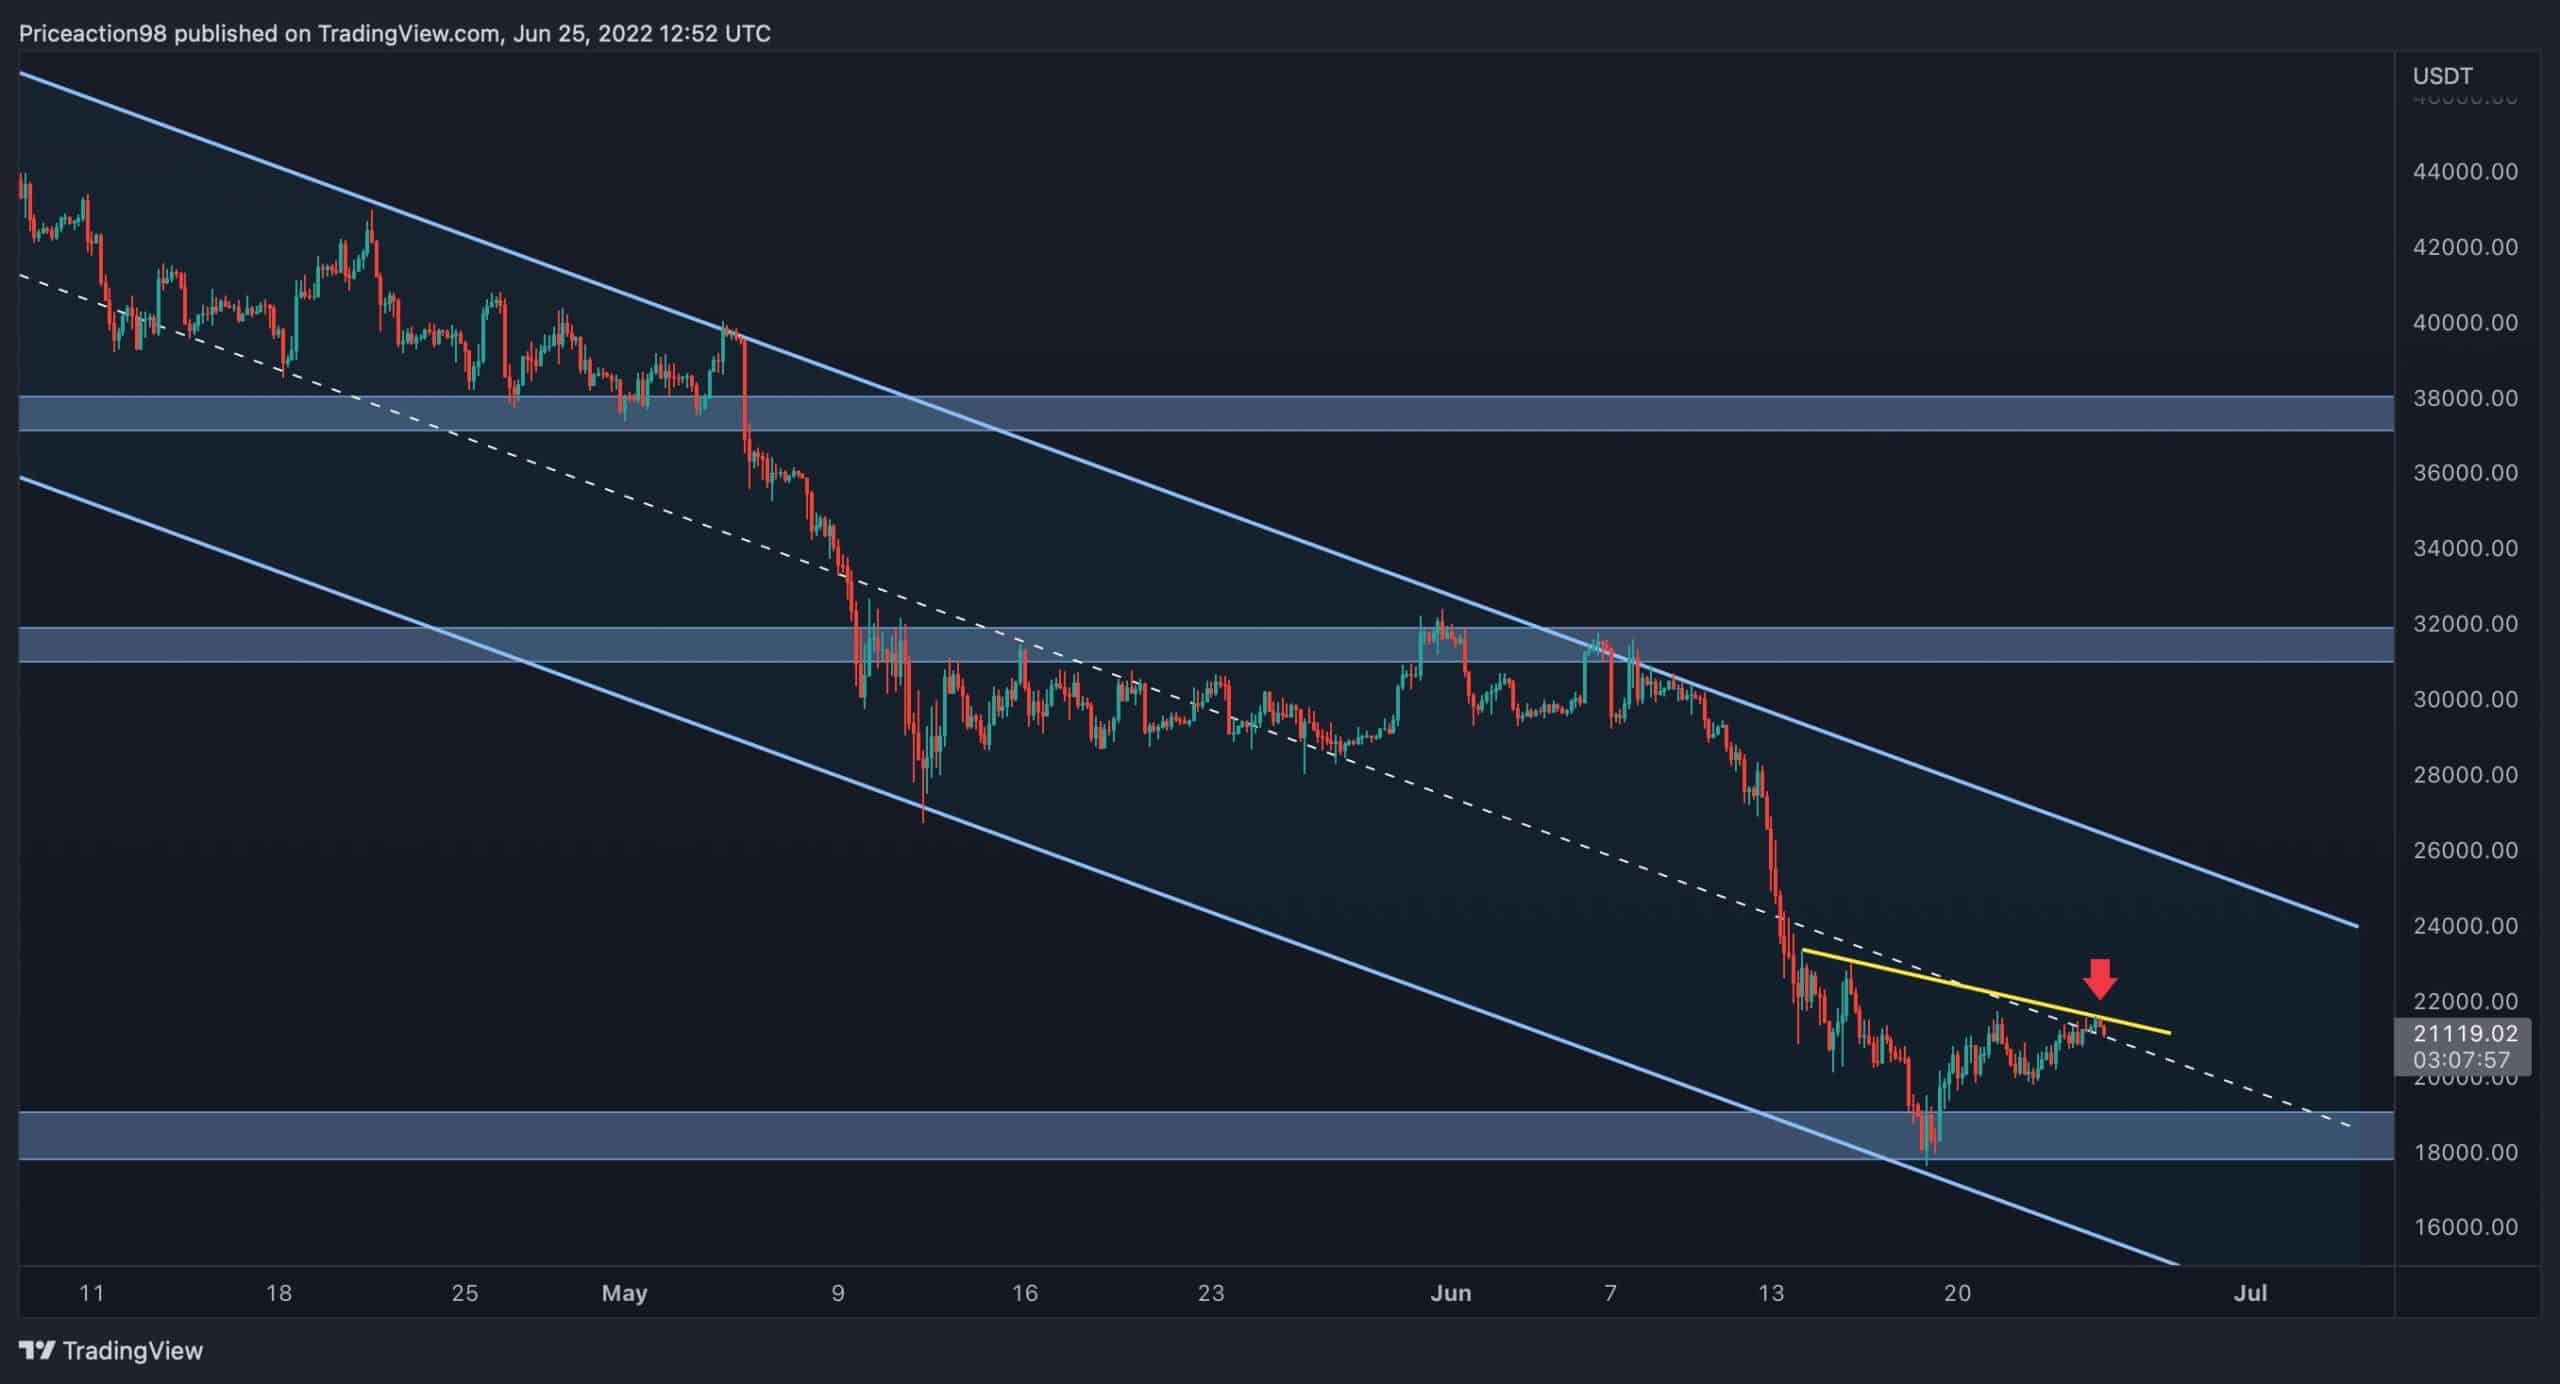
Табела од 4 часа
On the 4-hour timeframe, it is evident that the price has been forming a bearish descending channel. The primary support level at $20K and the channel’s lower boundary have ended the recent bearish impulsive move.
Currently, the price has reached the channel’s mid-trendline, which is the main barrier for Bitcoin in the 4-hour timeframe, and a descending trendline(yellow line). In the case of a reversal from this price region, the cryptocurrency needs to break the middle barrier and the yellow trendline to retest the channel’s upper boundary. Otherwise, the price will likely get rejected again, heading to retest the $17K for the second time.
Onchain анализа
Од Шајан
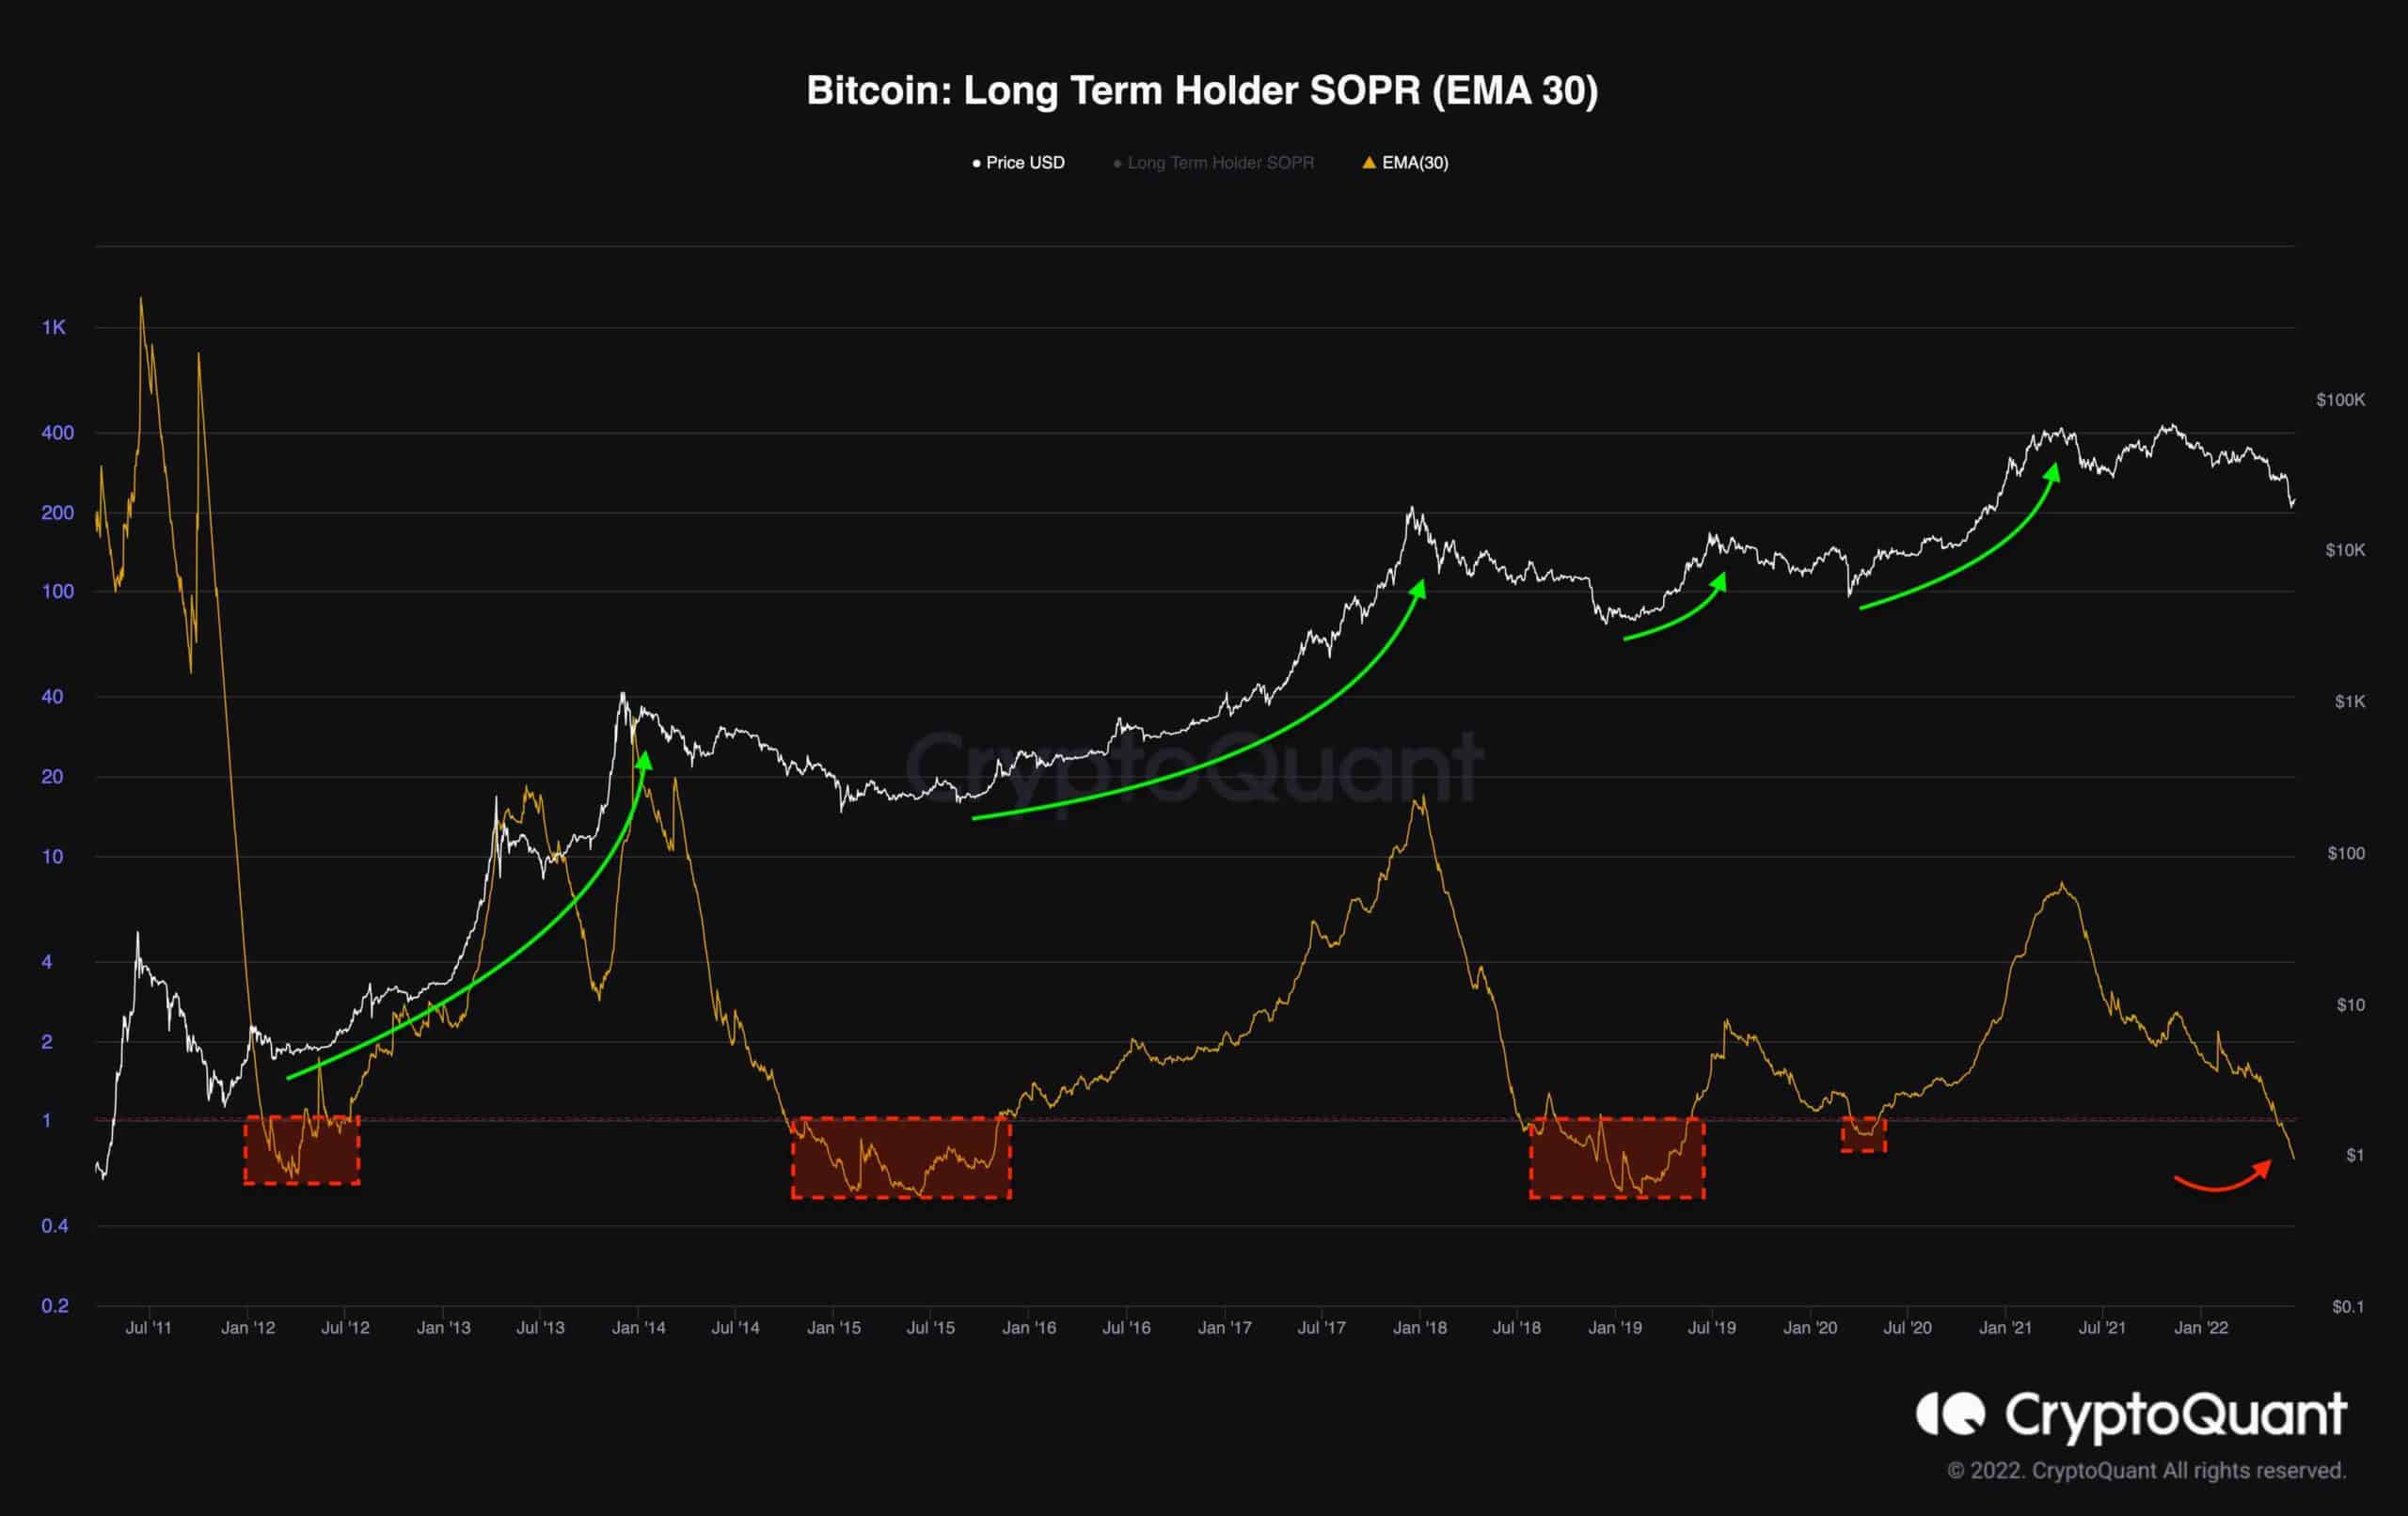
When market participants suffer significant losses, suggesting a “Capitulation” event, markets usually enter a bottom discovery structure phase. Given that long-term holders own most of the supply, there is a lot of emphasis on their capitulation in the Bitcoin market. A long-term holders’ capitulation phase is needed for a multi-year bottom to form.
This chart consists of the 30-day exponential moving average of the Long-Term Holder SOPR and Bitcoin’s price. It is apparent that during prior bear markets, a lengthy period of long-term holders’ capitulation occurred since they significantly realized losses. The fact that the metric has fallen below 1 indicates selling pressure from long-term investors. This has frequently triggered the last stage of the bear market. Nevertheless, It should be noted that this phase might take several frustrating months of volatility accompanied by numerous massive shakeouts.
Binance Free 100 $ (ексклузивно): Користете ја оваа врска да се регистрирате и да добиете бесплатни $100 и 10% попуст на таксите на Binance Futures првиот месец (услови).
PrimeXBT Специјална понуда: Користете ја оваа врска да се регистрирате и да го внесете кодот POTATO50 за да добиете до 7,000 УСД на вашите депозити.
Одрекување: Информациите пронајдени на CryptoPotato се оние на цитираните писатели. Не ги претставува мислењата на CryptoPotato за тоа дали да купи, продаде или да одржи инвестиции. Ве советуваме да спроведете свое истражување пред да донесете какви било решенија за инвестирање. Користете дадени информации на ваш сопствен ризик. Погледнете Одрекување за повеќе информации.
Табели за криптовалентност од TradingView.
Source: https://cryptopotato.com/btc-fights-with-21k-but-is-another-drop-coming-bitcoin-price-analysis/