The market is currently suffering from insufficient activity and liquidity. Meanwhile, Bitcoin’s price is up against a crucial resistance zone and is about to break out. The move should determine the upcoming direction and end the current close-to-neutral state between selling and buying pressure in the market.
Техничка анализа
By Шајан
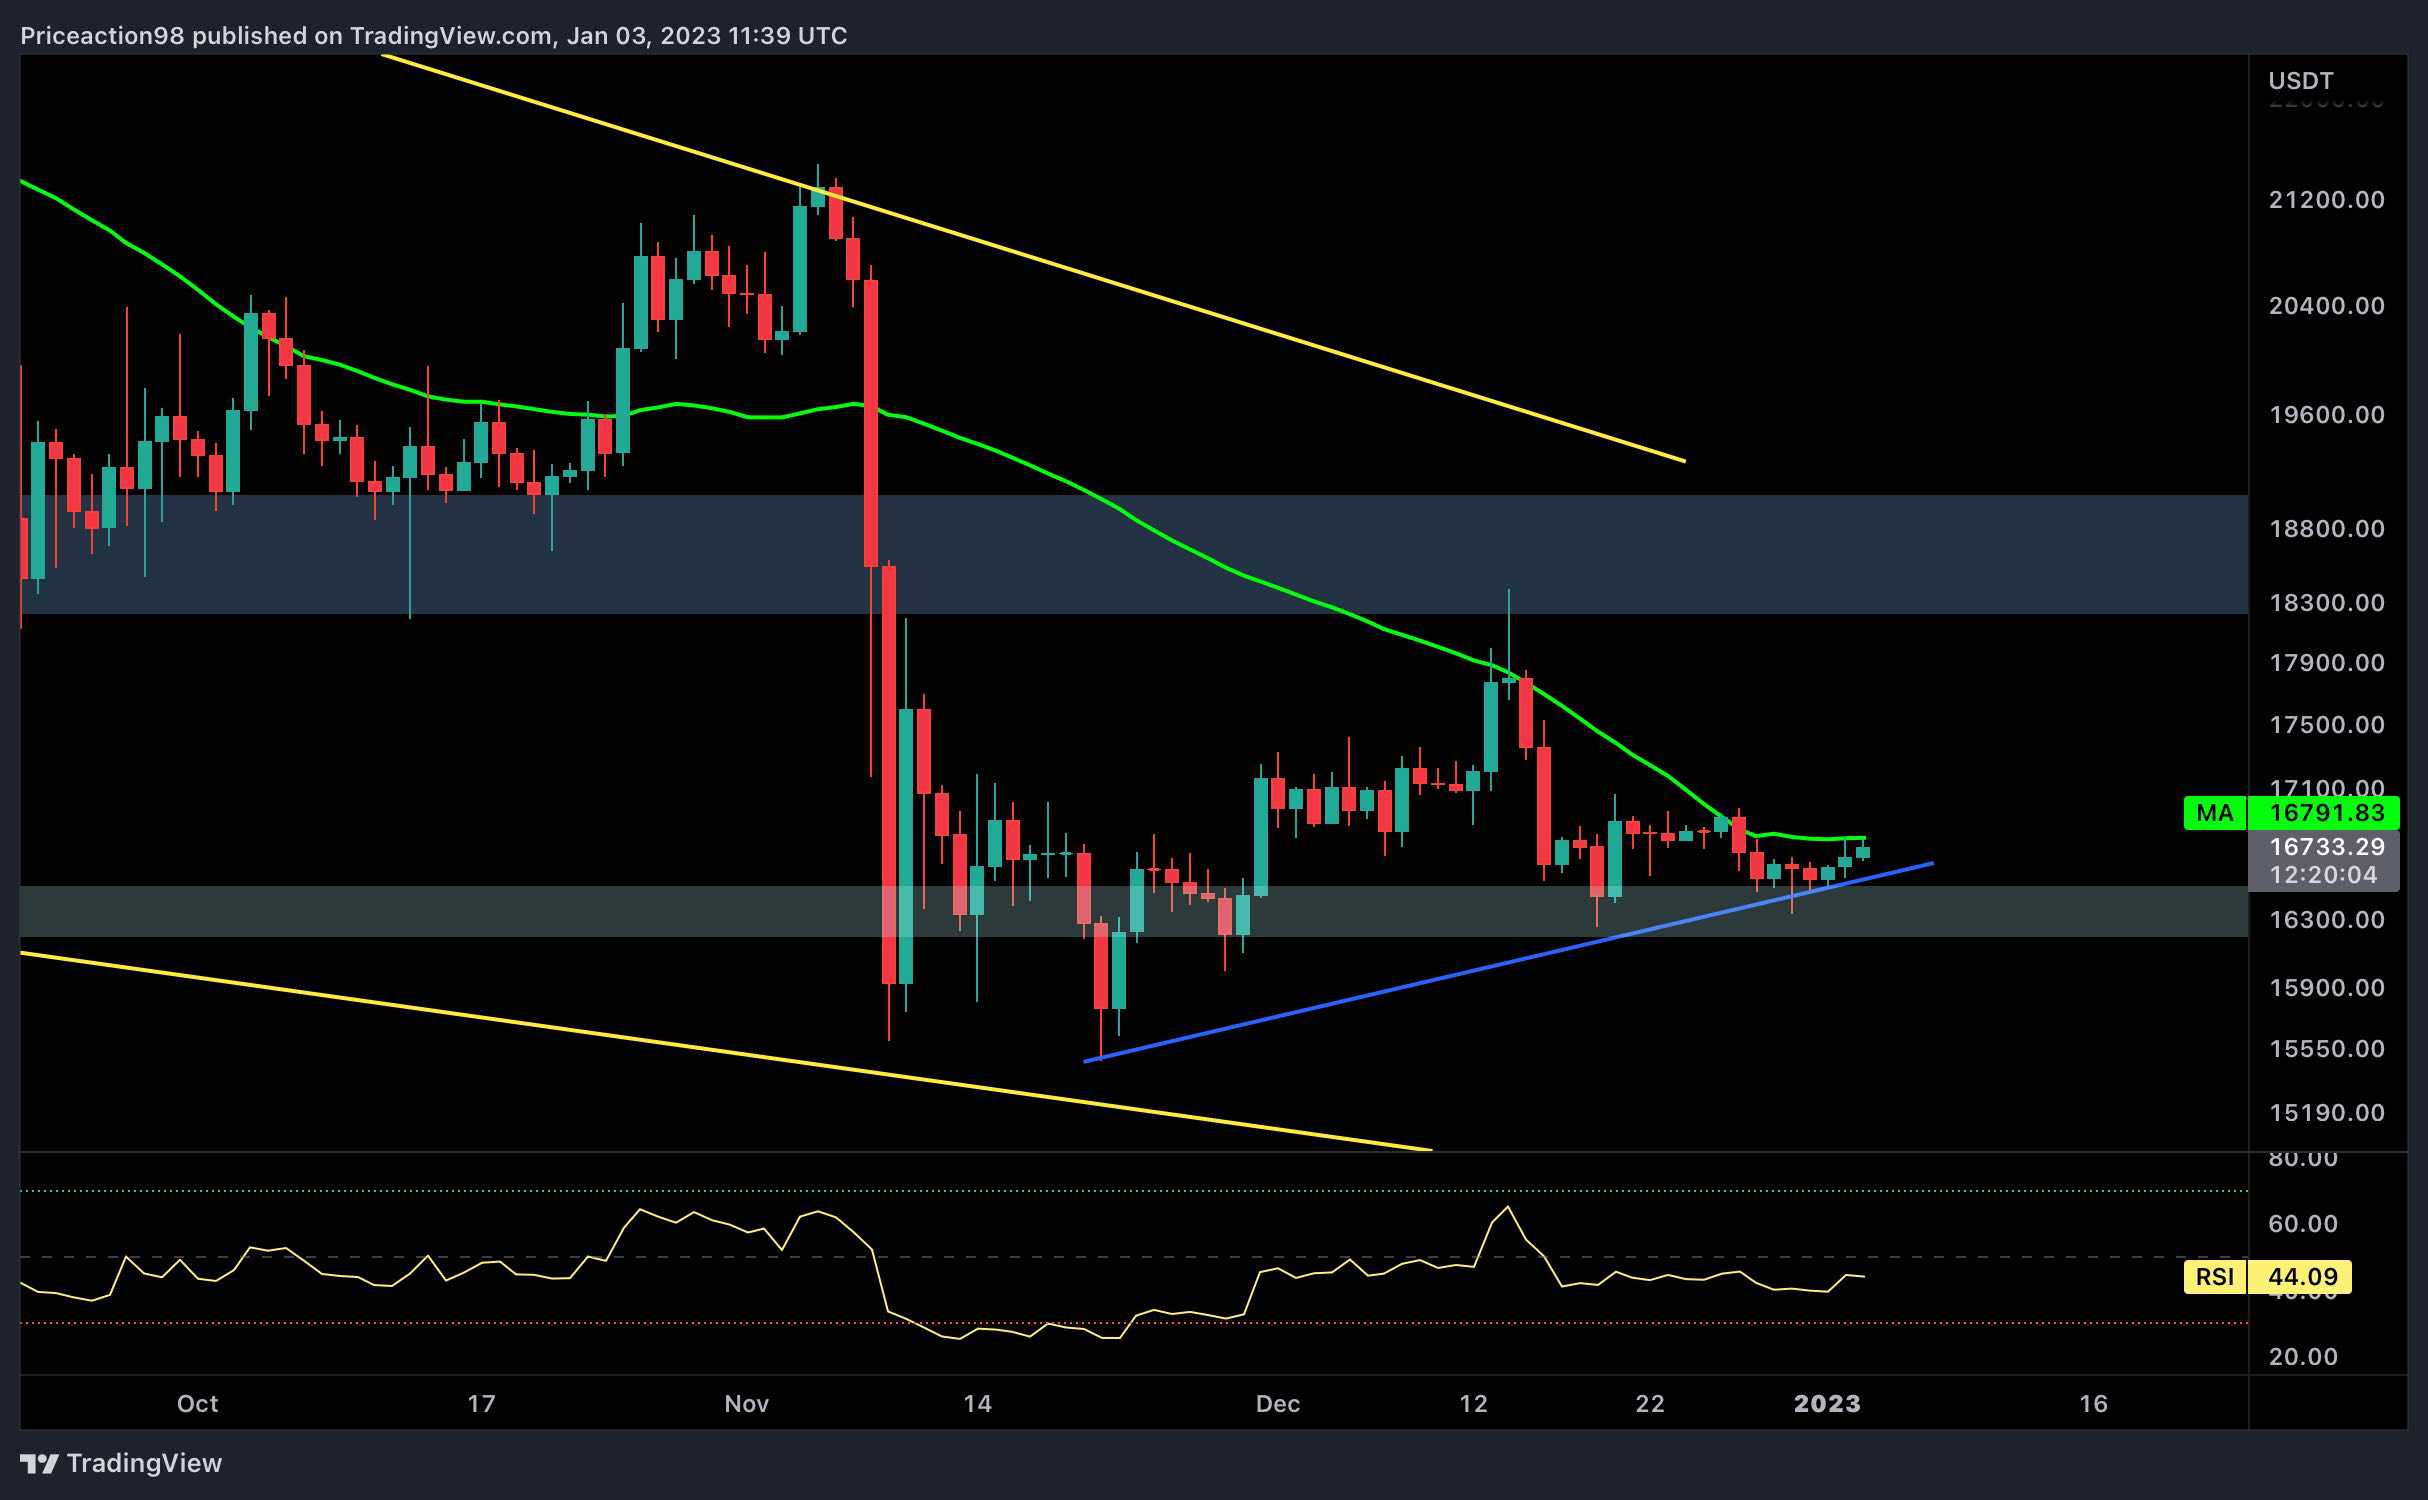
Дневниот графикон
After getting rejected by the 50-day moving average and consolidating for a few days, the price finally tested the blue trendline for the third time and failed to break it to the downside.
Next, the price started a small rally and reached the 50-day moving average at $16.8K. Bitcoin is now struggling within a significant resistance zone between the 50-day moving average and the blue trendline.

A breakout from the moving average will result in a rally with bullish momentum; contrarily, if the price drops below the trendline, a shakeout toward the $15K yearly low will be anticipated.
Yet, the upcoming price action should end the recent confusion between the bears and the bulls in deciding the mid-term market direction.
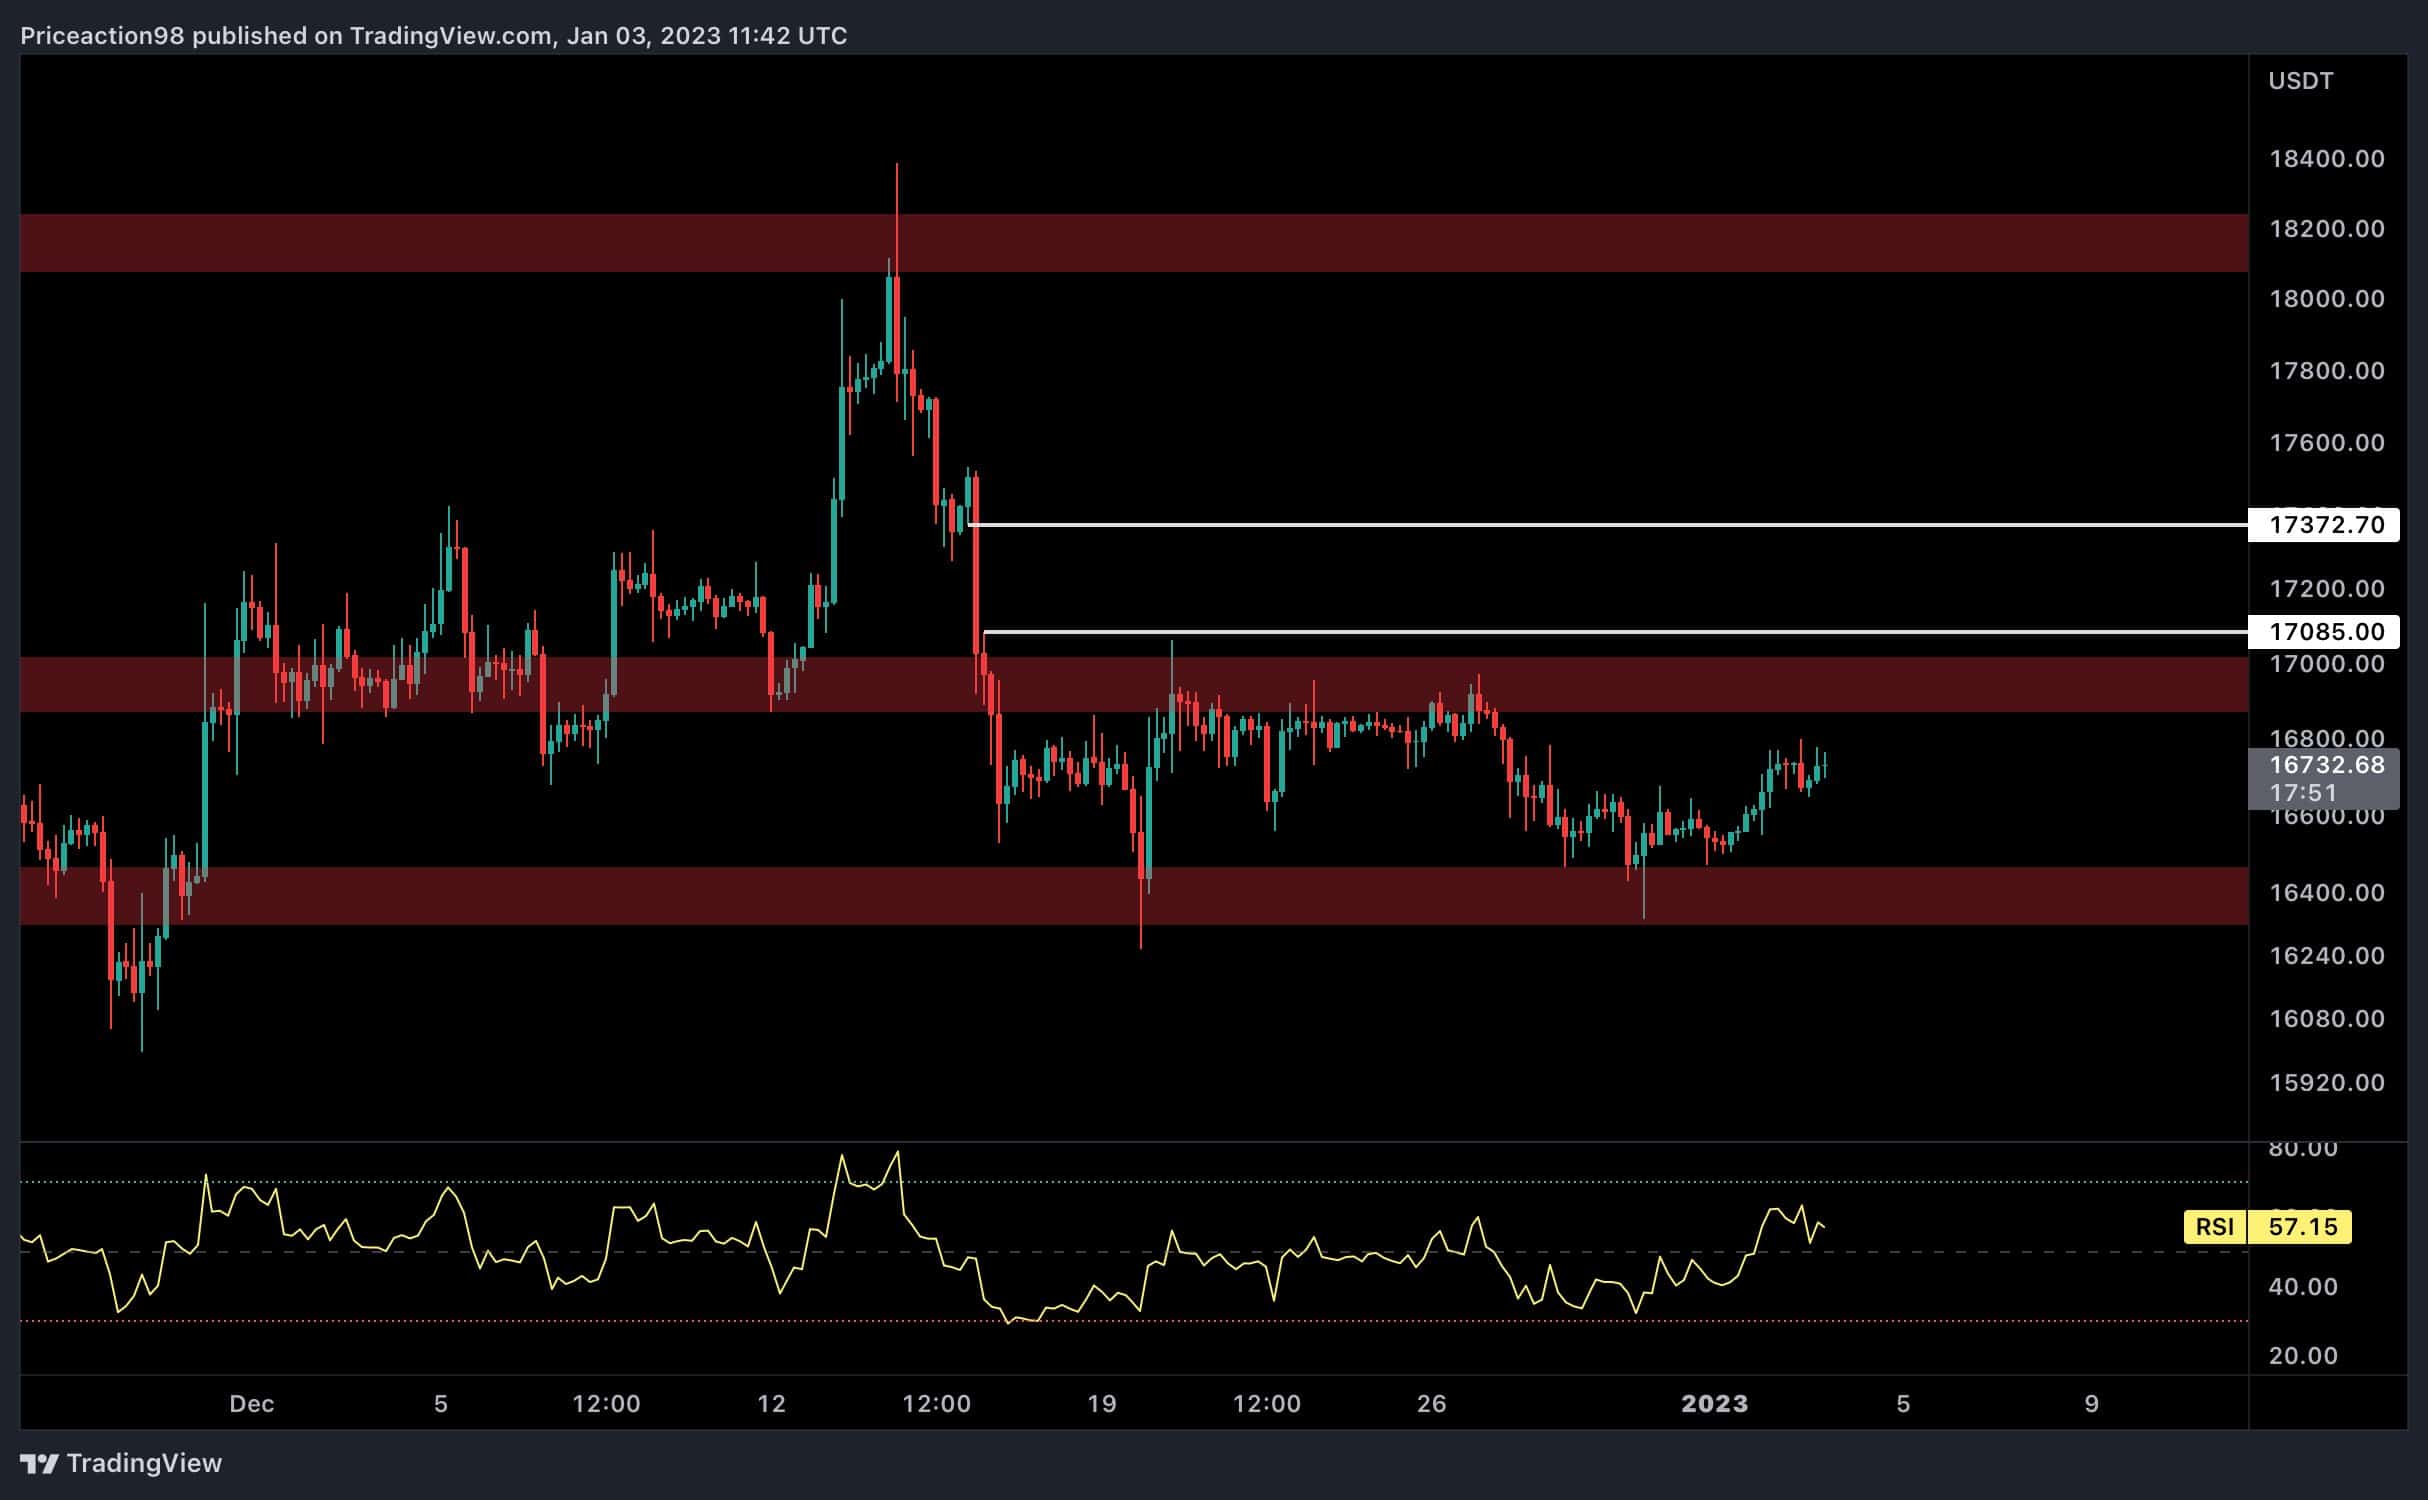
Табела од 4 часа
On the 4-hour time frame, the $16.4K region has become a promising support zone for the last couple of days. Most recently, the price initiated a small rally after retesting this level. However, the momentum is not promising, as Bitcoin has been printing small candles.
There is a static resistance level in Bitcoin’s path toward $18K, at $17K. Considering the weak momentum and the fragile neutral sentiment, the price will possibly consolidate in the range between the $16.4K support and the $17K resistance levels on a mid-term basis.
Onchain анализа
By Шајан
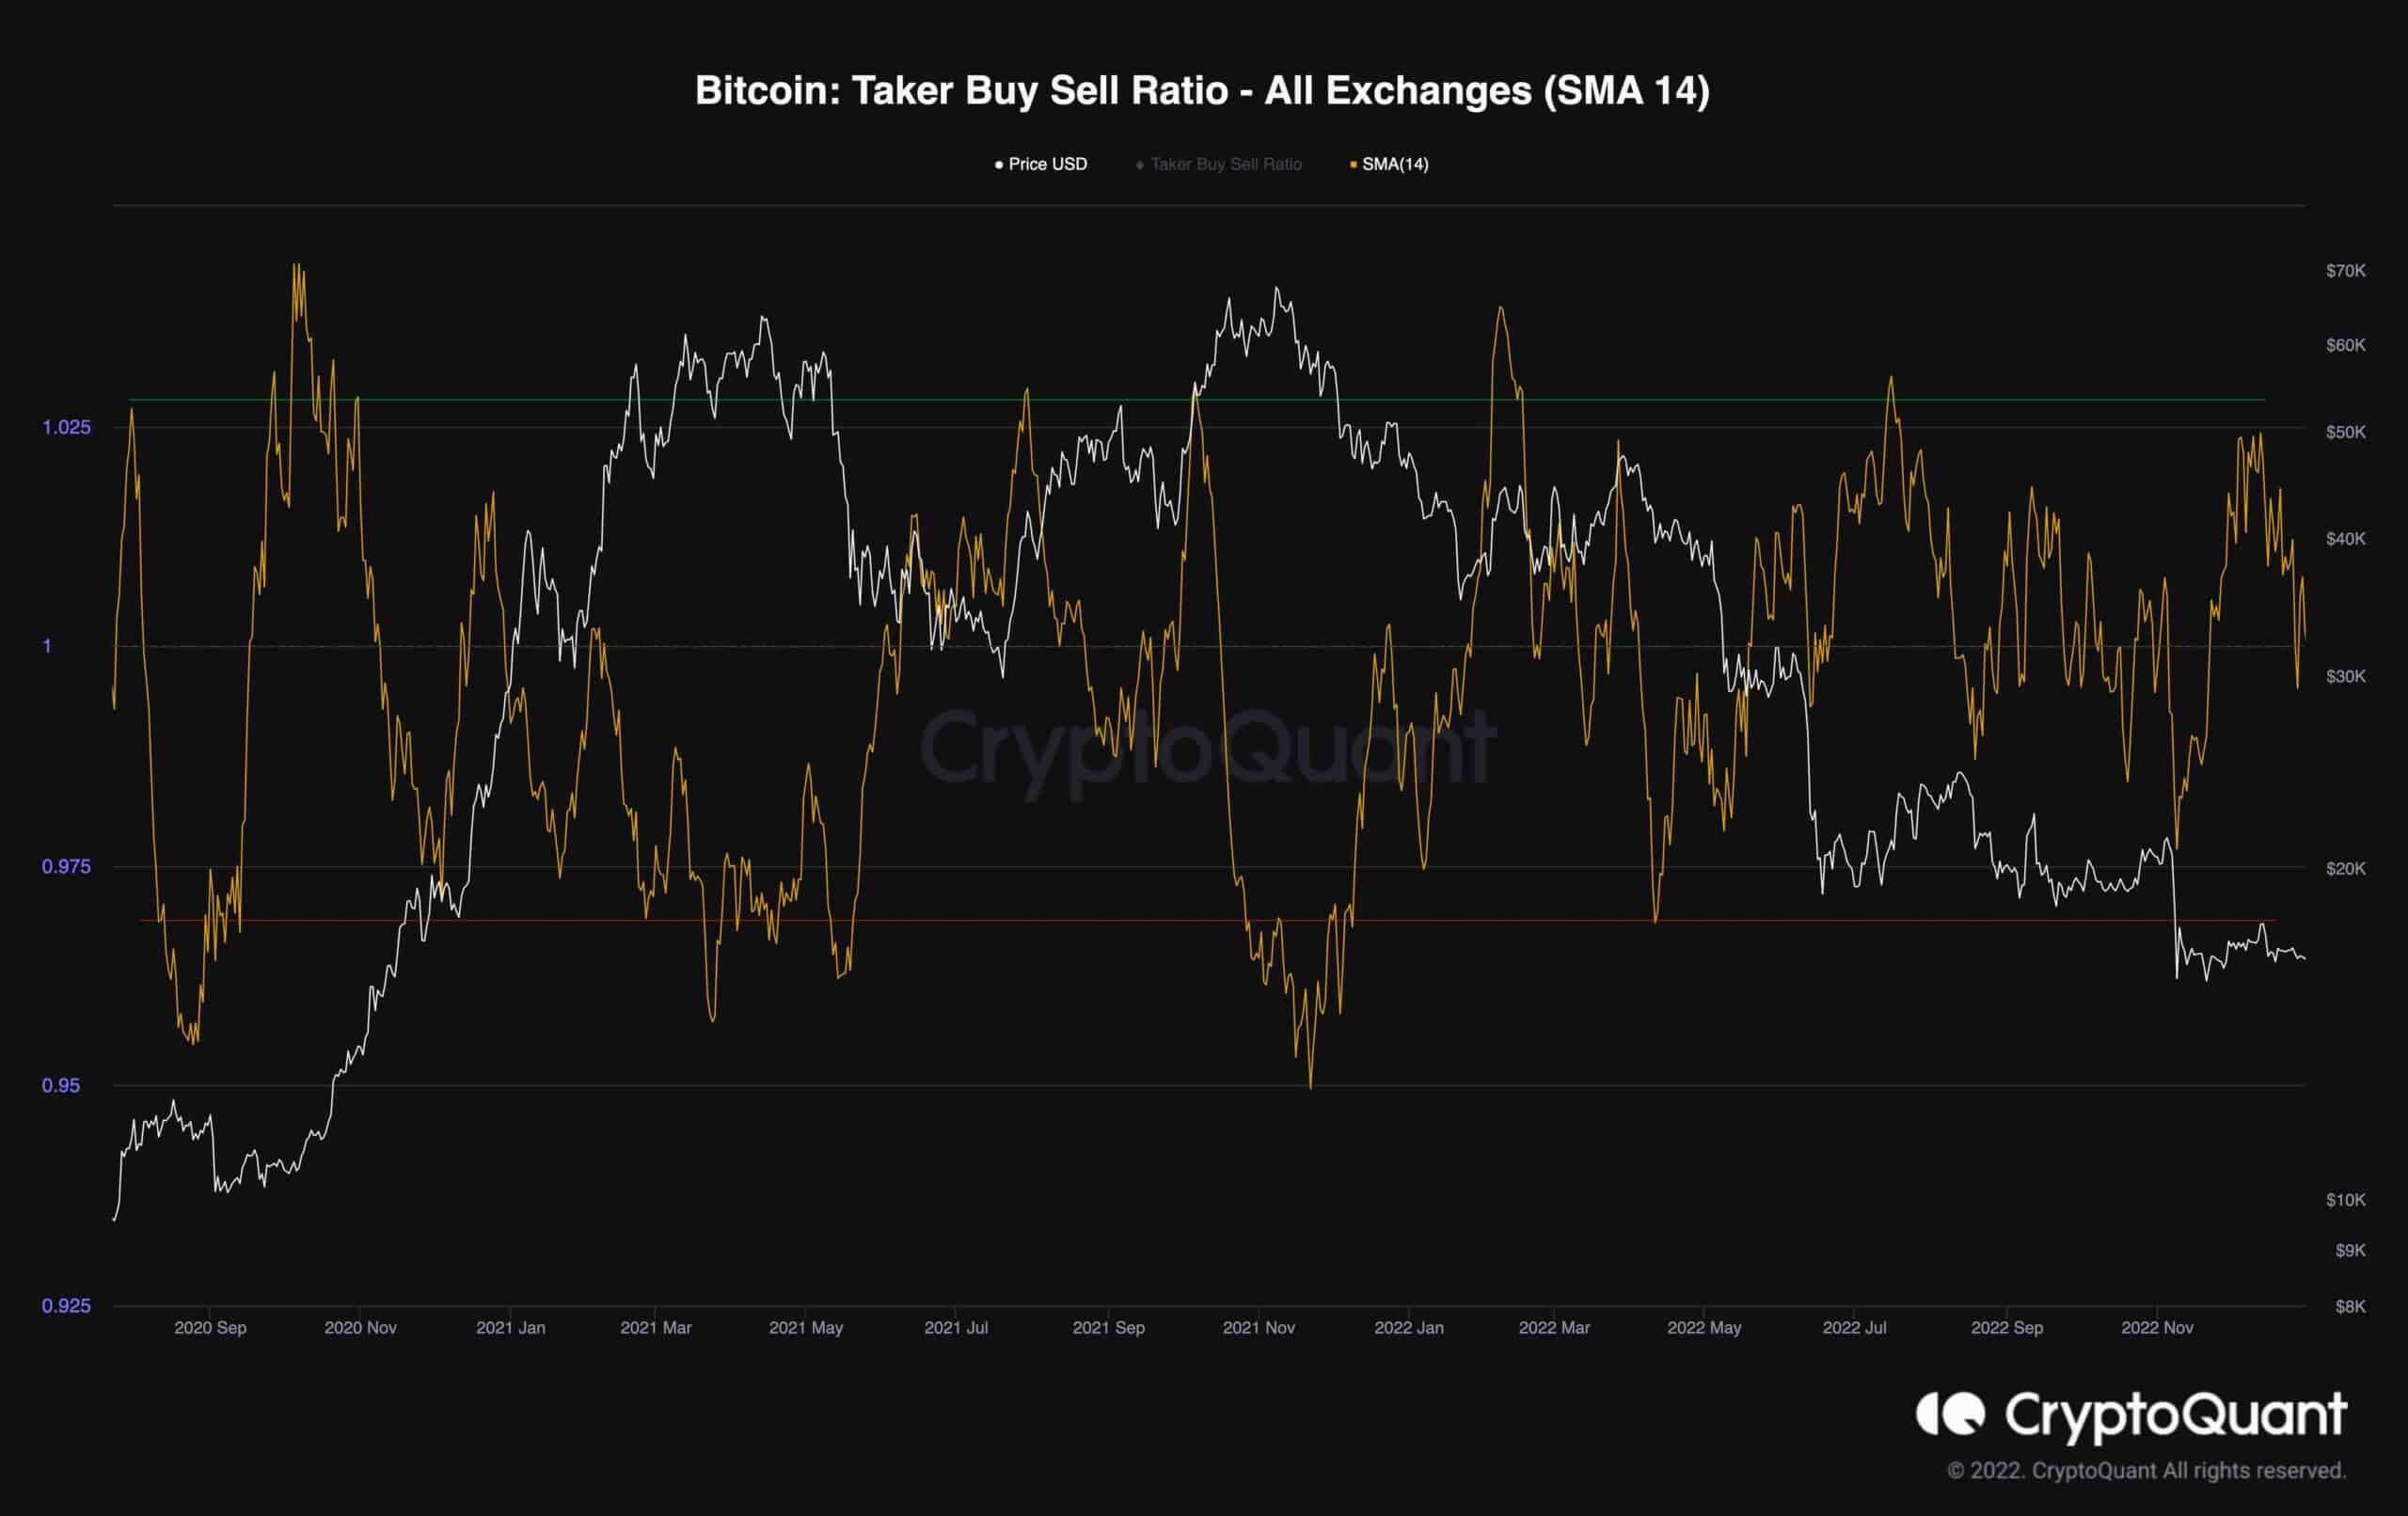
The chart below illustrates the Taker Buy/Sell Ratio metric alongside Bitcoin’s price. The metric is the ratio of buy volume divided by the sell volume for takers in perpetual swap trades tracing the overall sentiment in the derivative market. Values over 1 indicate predominant bullish sentiment, while values under 1 indicate bearish sentiment is prevailing.
As the chart shows, there are two apparent static levels; 1.03 (in green) and 0.97 (in red). The price has experienced a bullish surge whenever the metric surpassed the 1.03 level. Alternatively, Bitcoin has plunged while the metric tumbled below the red line as more sell orders were filled.
The current value has been consolidating around one since August 2022, denoting long-time neutrality in the perpetual market due to a lack of liquidity. Bitcoin is far-fetched to initiate a promising rally if liquidity or sufficient demand doesn’t return to the market.
Binance Free 100 $ (ексклузивно): Користете ја оваа врска да се регистрирате и да добиете бесплатни $100 и 10% попуст на таксите на Binance Futures првиот месец (услови).
PrimeXBT Специјална понуда: Користете ја оваа врска да се регистрирате и да го внесете кодот POTATO50 за да добиете до 7,000 УСД на вашите депозити.
Одрекување: Информациите пронајдени на CryptoPotato се оние на цитираните писатели. Не ги претставува мислењата на CryptoPotato за тоа дали да купи, продаде или да одржи инвестиции. Ве советуваме да спроведете свое истражување пред да донесете какви било решенија за инвестирање. Користете дадени информации на ваш сопствен ризик. Погледнете Одрекување за повеќе информации.
Табели за криптовалентност од TradingView.
Source: https://cryptopotato.com/calm-before-the-storm-or-will-bitcoin-continue-consolidating-btc-price-analysis/