Despite the relative calmness in the market, the price action is not showing signs of a robust recovery. Although the US stock closed yesterday with a green candle and the DXY index has gone down for the past three days, Bitcoin has not been successful in stabilizing above the critical $30K level. Fear and doubt still dominate the market.
Техничка анализа
By гризли
Дневниот графикон
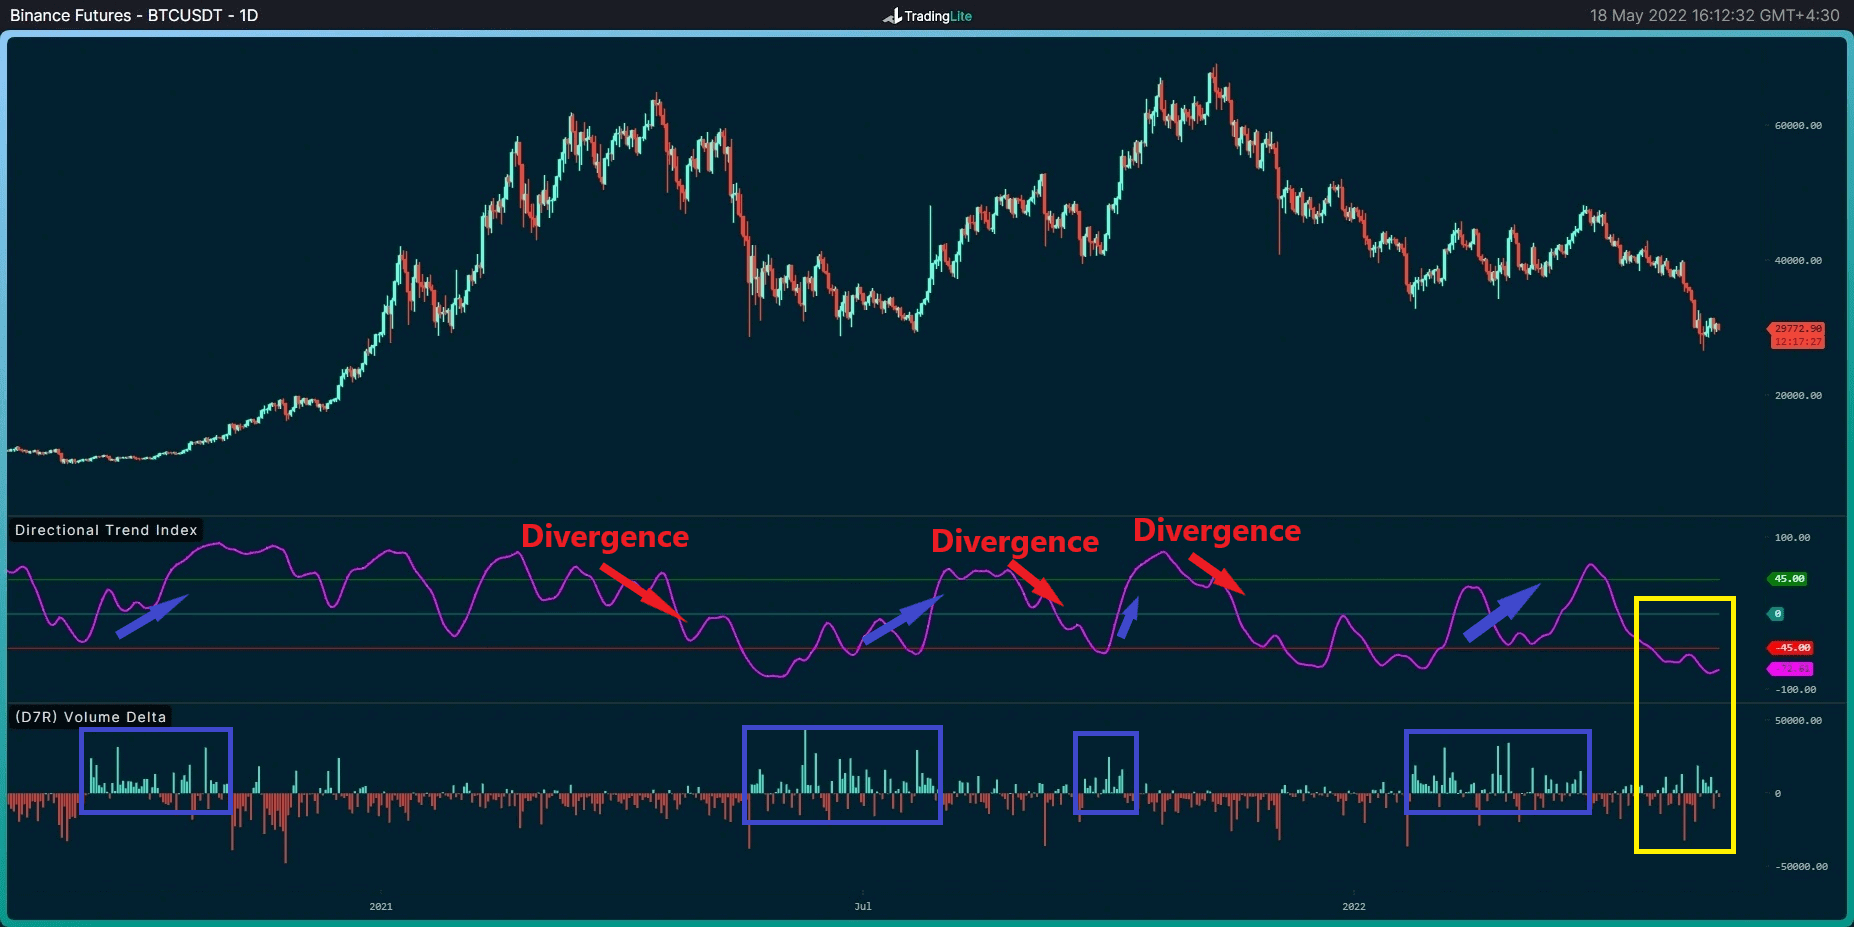
The Binance-Futures price and order-book chart are shown below on the daily timeframe.
Considering the historical trends over the last two years, the upward trends usually have been accompanied by an increase in the Volume Delta, which indicates the dominance of takers-buy pressure alongside an increase in the Directional Trend Index (in blue). On the other hand, downward trends have often occurred with divergence in the Directional Trend Index and the dominance of takers-sell pressure (in red).
Throughout this week, the takers-sell pressure has been gradually diminishing. To some extent, takers-buy orders have also entered the market (not significantly), which has caused histogram bars to turn green in the volume delta. But the directional trend index is still moving below the red line, indicating the trend’s weakness.

Suppose the taker buyers start to buy aggressively, and the directional trend index breaks the red line and the blue one. In that case, the reversal of the trend will be confirmed according to this strategy. Otherwise, BTC is likely to remain bearish as there are no signs of a turnaround.
Клучни нивоа на поддршка: 28,700 и 25,400 долари
Клучни нивоа на отпорност: 31,700 и 32,900 долари
Подвижни просеци:
MA20: 33,611 долари
MA50: 38,620 долари
MA100: 39,986 долари
MA200: 44,835 долари
Табела од 4 часа
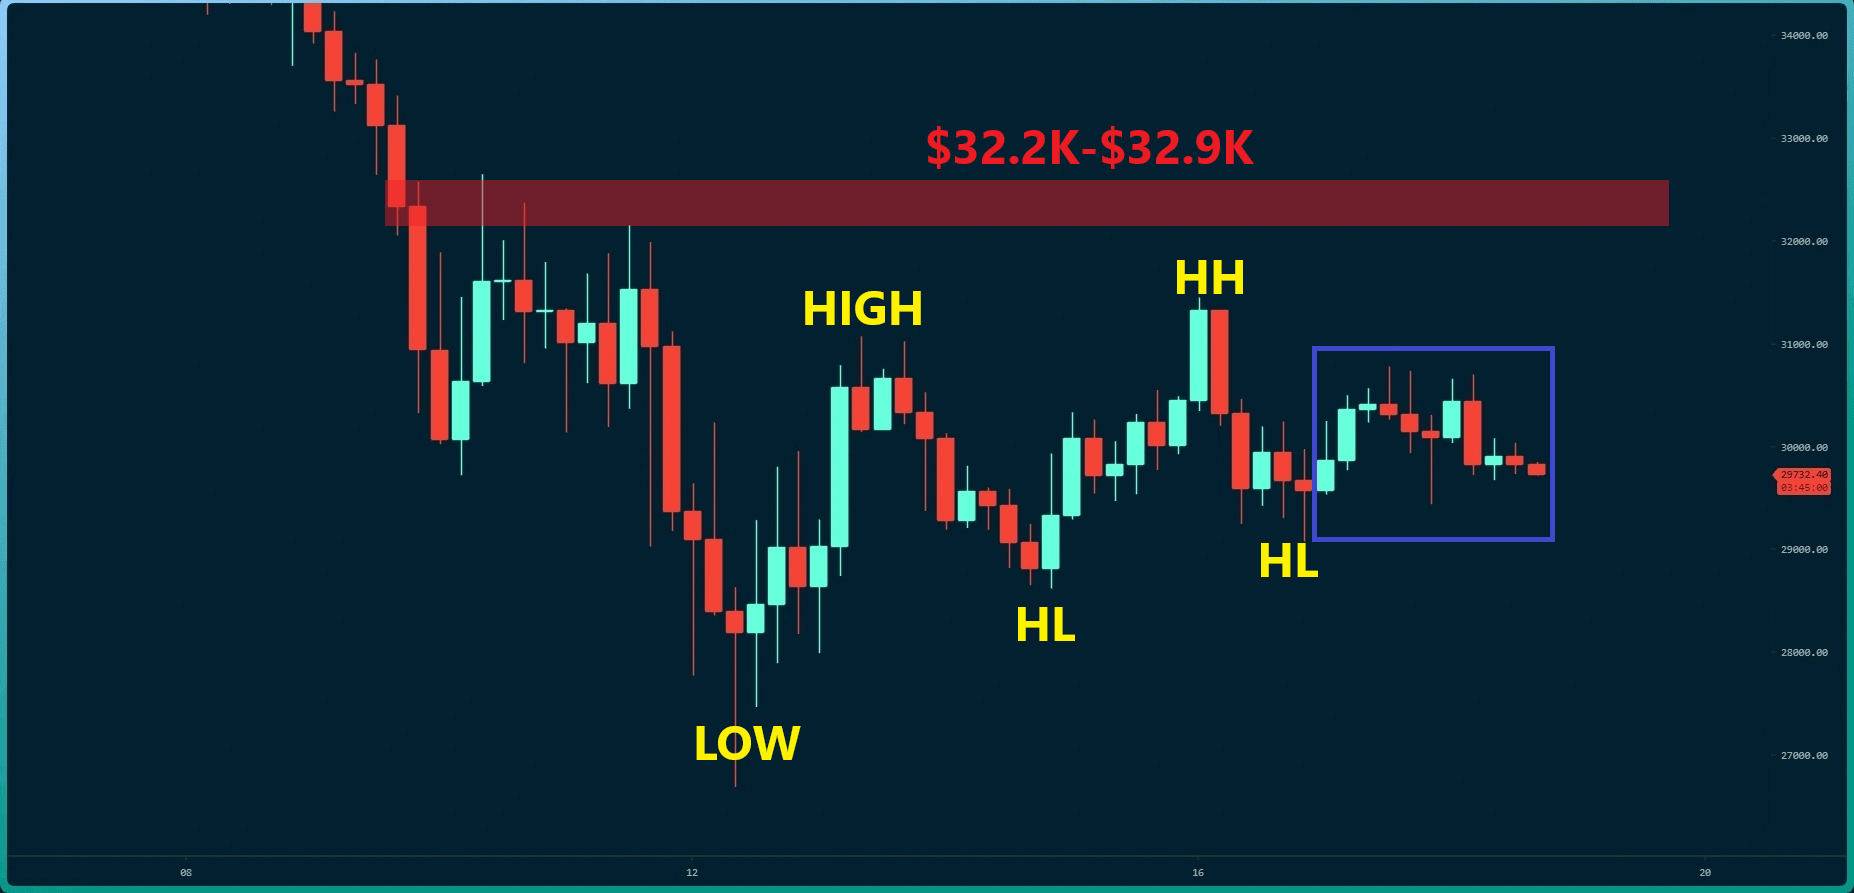
On the 4-hour timeframe, the bullish structure shows some weakness in its last wave. If the bulls can hold the previous higher low at $29K and then push the price above the red resistance zone, it can be expected that an uptrend momentum will be formed in the short term. Otherwise, the lower levels might likely be tested again.
Bitcoin currently struggles with 4H MA50 (as resistance) at $ 29K. The RSI indicator is also moving up in the bearish zone and is close to the baseline, confirming the lack of bullish momentum.
Анализа на синџир
Размена на мрежи
Дефиниција: The difference between coins flowing into and out of the exchange. (Inflow – Outflow = Netflow). A positive value indicates the reserve is increasing due to net inflow.
- For spot exchange, a high value indicates increasing selling pressure.
- For derivative exchange, a high value indicates possible high volatility.
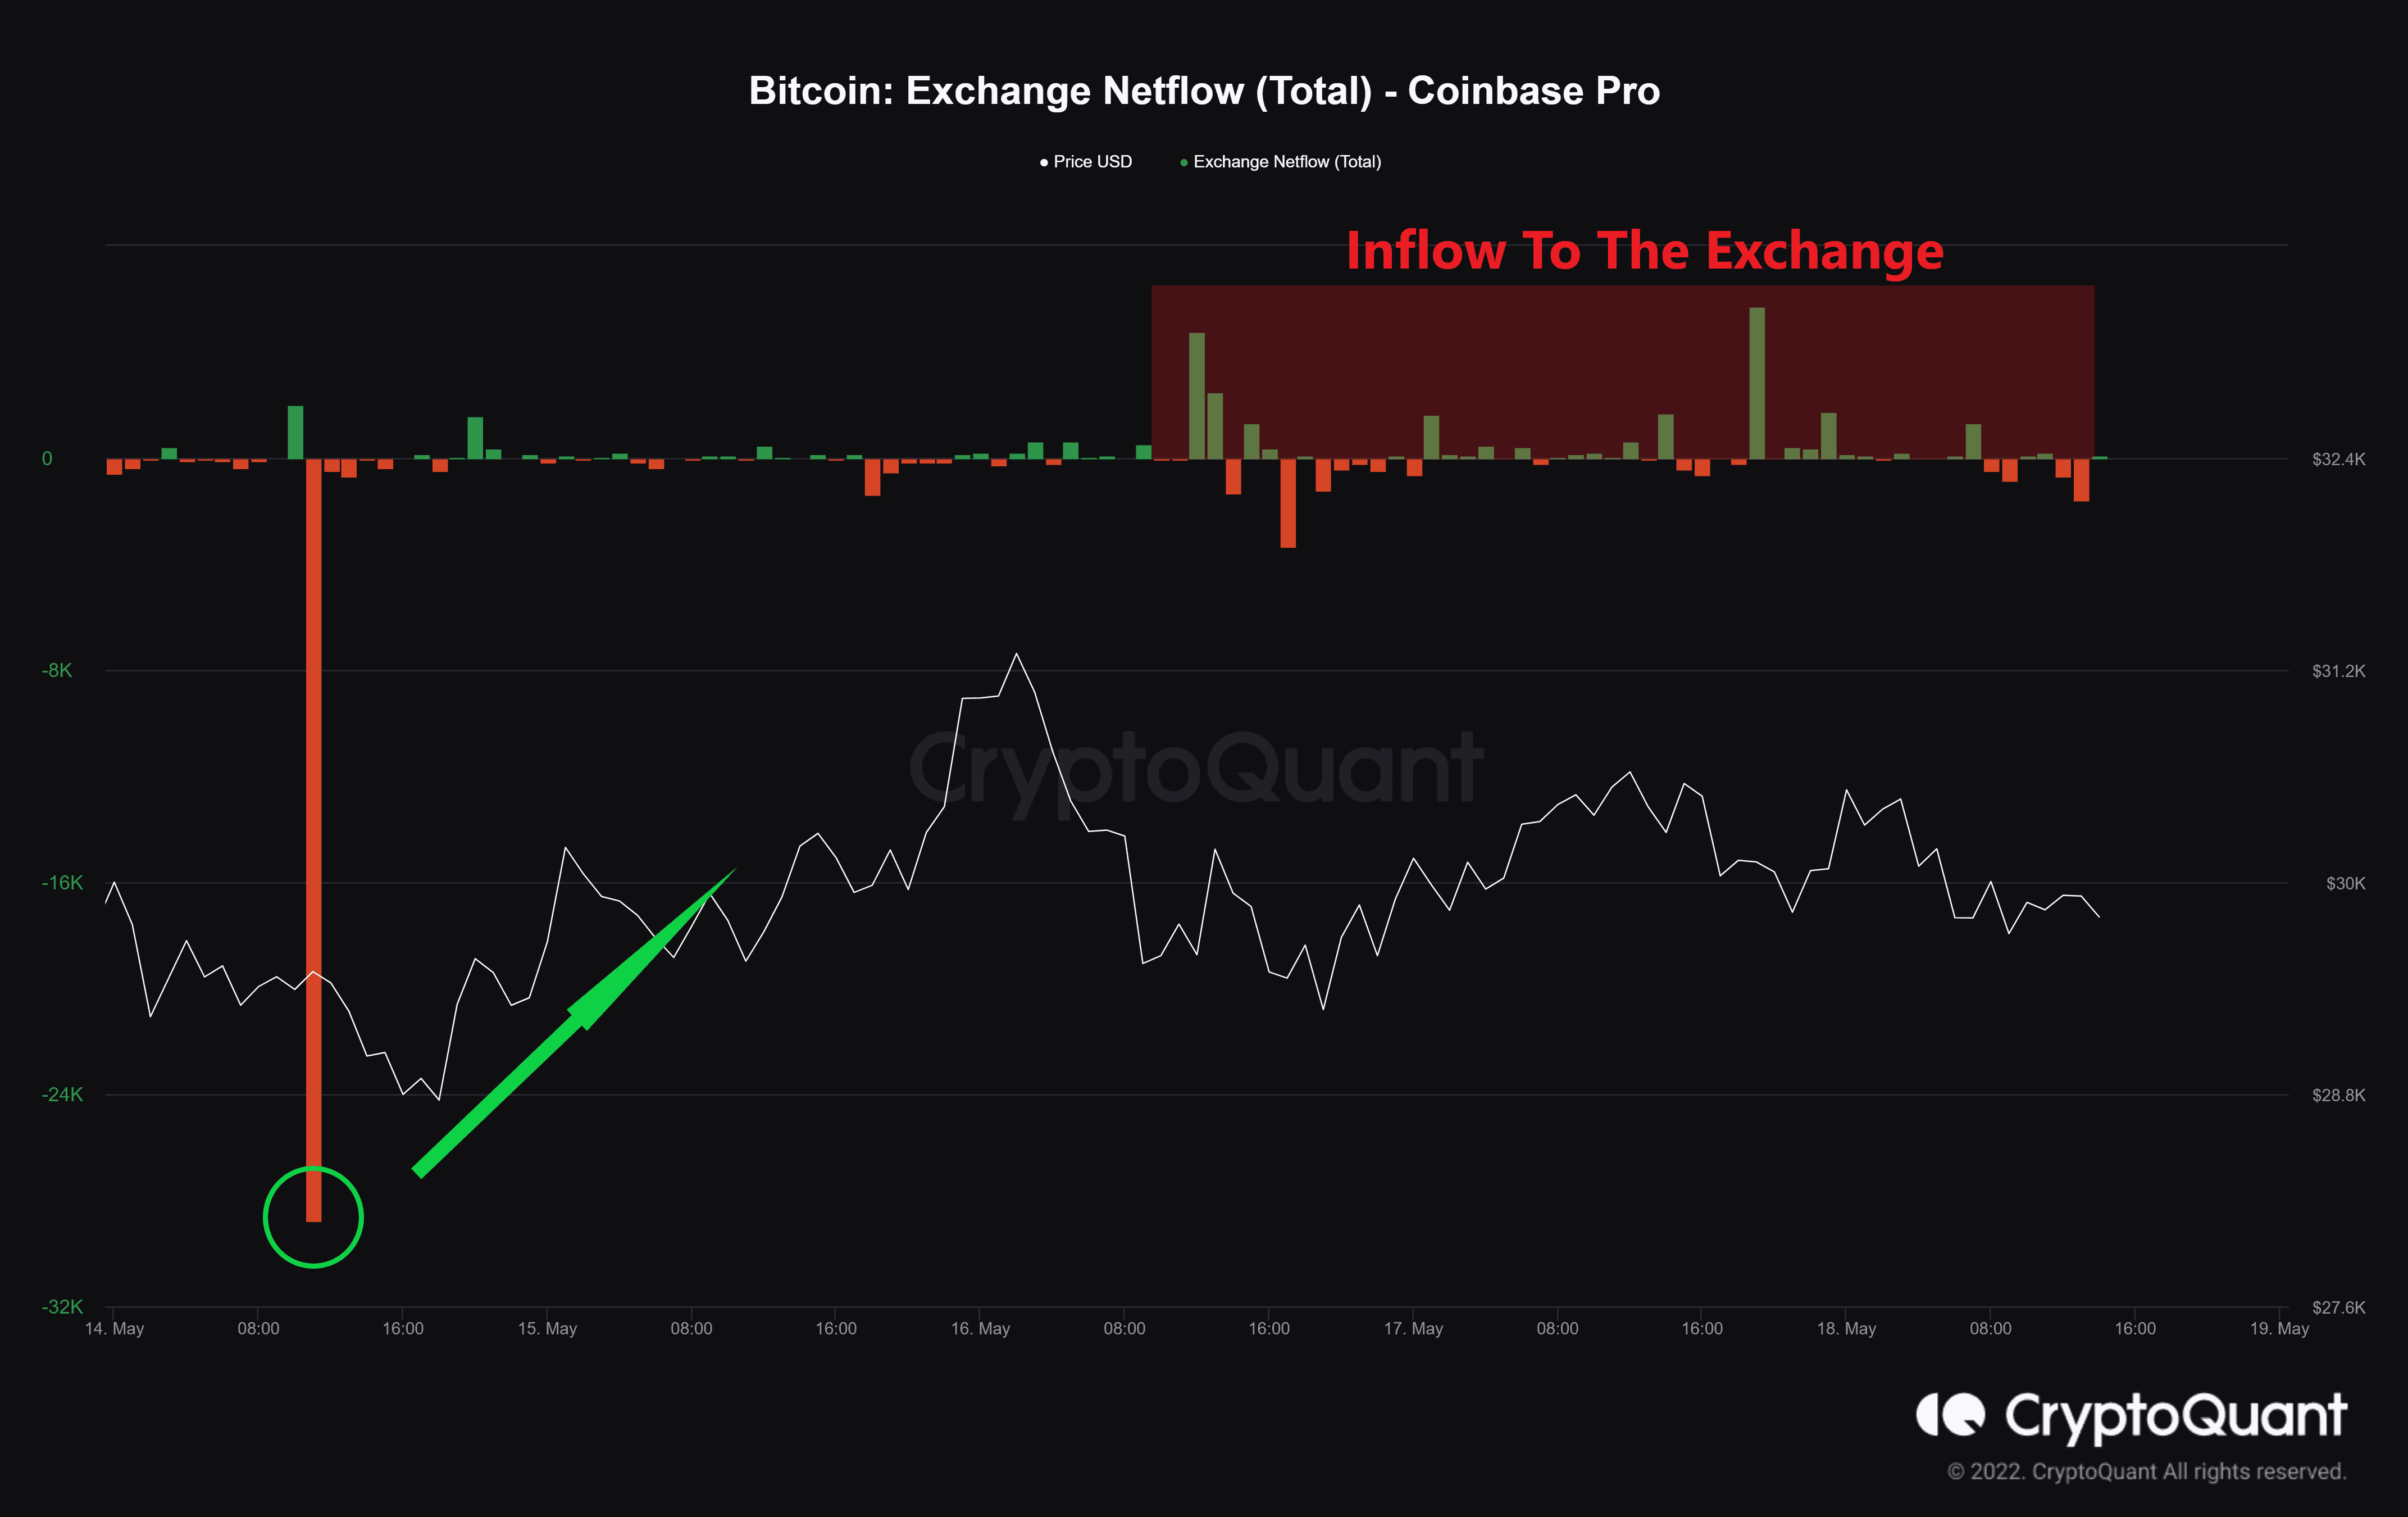
BTC inflow into the Coinbase exchange in the last two days has exceeded the outflow. Just the same way that the withdrawal of 29493 bitcoins from the Coinbase on May 14 caused a short-term uptrend, one must be careful about this particular inflow to Coinbase and reduce the risk according to any unusual regime of significant inflows.
Binance Free 100 $ (ексклузивно): Користете ја оваа врска да се регистрирате и да добиете бесплатни $100 и 10% попуст на таксите на Binance Futures првиот месец (услови).
PrimeXBT Специјална понуда: Користете ја оваа врска да се регистрирате и да го внесете кодот POTATO50 за да добиете до 7,000 УСД на вашите депозити.
Одрекување: Информациите пронајдени на CryptoPotato се оние на цитираните писатели. Не ги претставува мислењата на CryptoPotato за тоа дали да купи, продаде или да одржи инвестиции. Ве советуваме да спроведете свое истражување пред да донесете какви било решенија за инвестирање. Користете дадени информации на ваш сопствен ризик. Погледнете Одрекување за повеќе информации.
Табели за криптовалентност од TradingView.
Source: https://cryptopotato.com/this-is-bitcoins-first-target-for-a-potential-recovery-btc-price-analysis/