According to recent SEC filings, a hedge fund led by Мајкл Бари, famous for correctly predicting the epic “Big Short” of the US housing market in 2008, has bet more than $1.6 billion on short positions against the US stock market. On-chain data analyses how Bitcoin prices could react to a major wobble in the stock market.
The latest CPI data from the US Bureau of Statistics on August 10 shows that the inflation growth rate has cooled. However, investors remain convinced that the Fed is still far from significant rate cuts.
In effect, some big players have started to place large bets against the stock market.
Micheal Burry’s hedge fund Scion Asset Management has bought $866 million and $739 million in Ставете Опции against the S&P 500 and Nasdaq 100, respectively. In simple terms, a Стави Опција represents the right to sell an asset at a particular price in the future.
Similarly, a US Senator, Tom Carper, stirred controversy earlier this month. A recent Beincrypto publication revealed his $30,000 investment in ProShares Short QQQ (PSQ) — an inverse exchange-traded fund (ETF), betting against the Nasdaq-100 index.
With Wall Street bigwigs and politically exposed investors taking out bets against the stock market, interest in the potential impact on crypto prices in the coming weeks is rife.
Bearish Trends Have Sparked a Correlation Between US Stocks and Crypto Market
Bitcoin (BTC) exhibits no statistical relationship with Nasdaq 100 and S&P 500 indexes, according to a recent report for data analysts platform BlockScholes. This means the stock market no longer has a causal effect on the crypto markets, as initially observed years ago.
However, recent bearish data trends have sparked a growing correlation between investor behavior in both markets. While S&P 500 is currently down 4% in August, BTC has lost 5% since August 2.
The chart below illustrates that the BTC/S&P 500 Correlation Coefficient has been trending upward in August. Between August 1 and August 17, it increased considerably from -0.65 to 0.47.
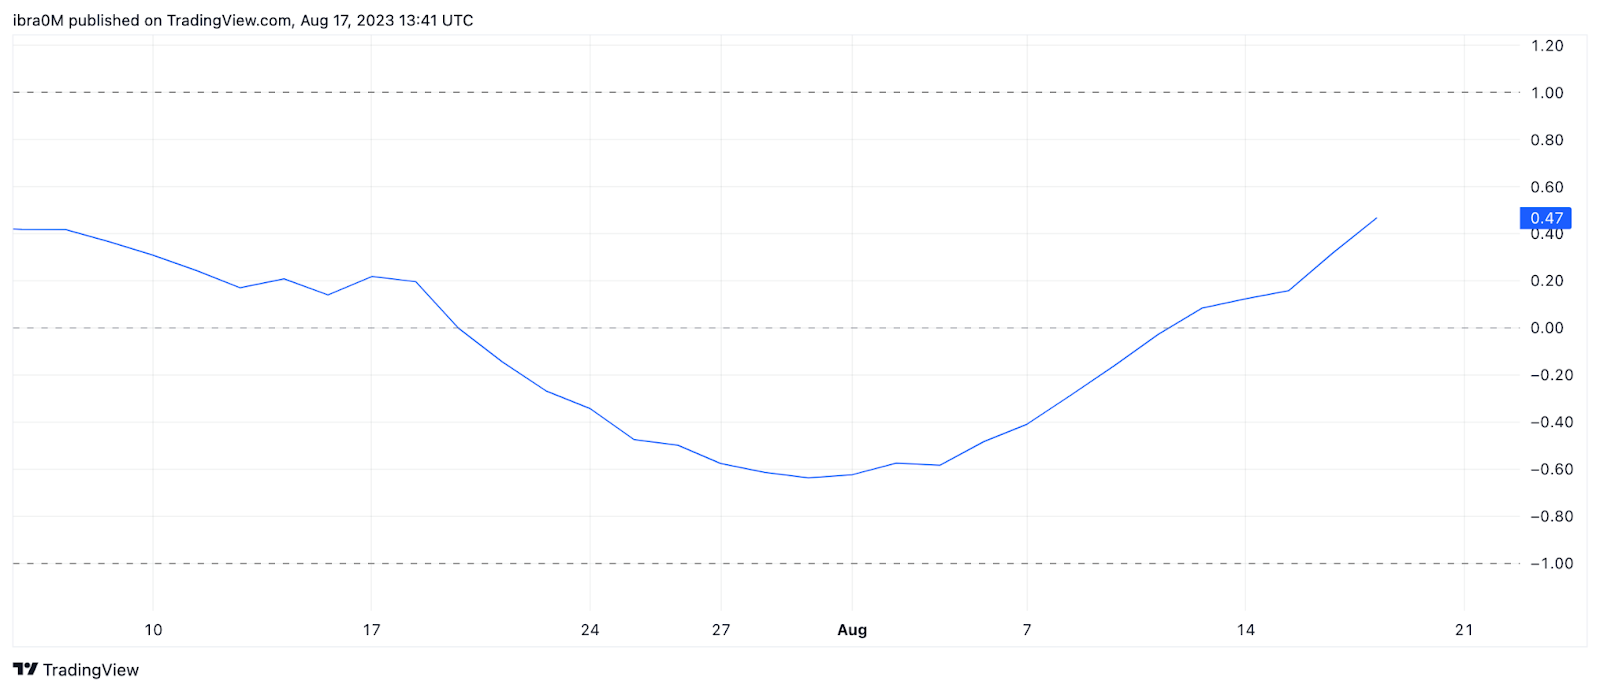
на Коефициент на корелација is a statistical measure that quantifies the direction and degree to which two distinct variables are connected. The chart above shows that, albeit to varying degrees, both Bitcoin and Stock market prices have largely trended in the same direction in August.
Delving deeper, at 0.47, a 10% change in US stock market prices will likely be followed by a 4.7% change in BTC price in the same direction.
Hence, if this positive correlation trend holds true in the coming weeks, if Wall Street investors trigger a stock market downswing as they continue to front-run further Fed rate hikes, the BTC price will likely head in the same direction.
The Demand for BTC is Dropping Among US Investors
While Wall Street bigwigs are taking outright short positions against the stock market, vital on-chain data now shows demand for BTC is cooling among US institutional investors.
Coinbase Премиум Индекс compiled by Cryptoquant, shows the percentage difference between Bitcoin prices on Coinbase Pro and Binance.
While Binance dominates the global mass market, Coinbase is widely regarded as the choice crypto exchange for US-based institutional and high-net-worth investors.
Hence, negative values of the Premium Index values indicate a decline in buying US investors’ buying pressure on Coinbase.
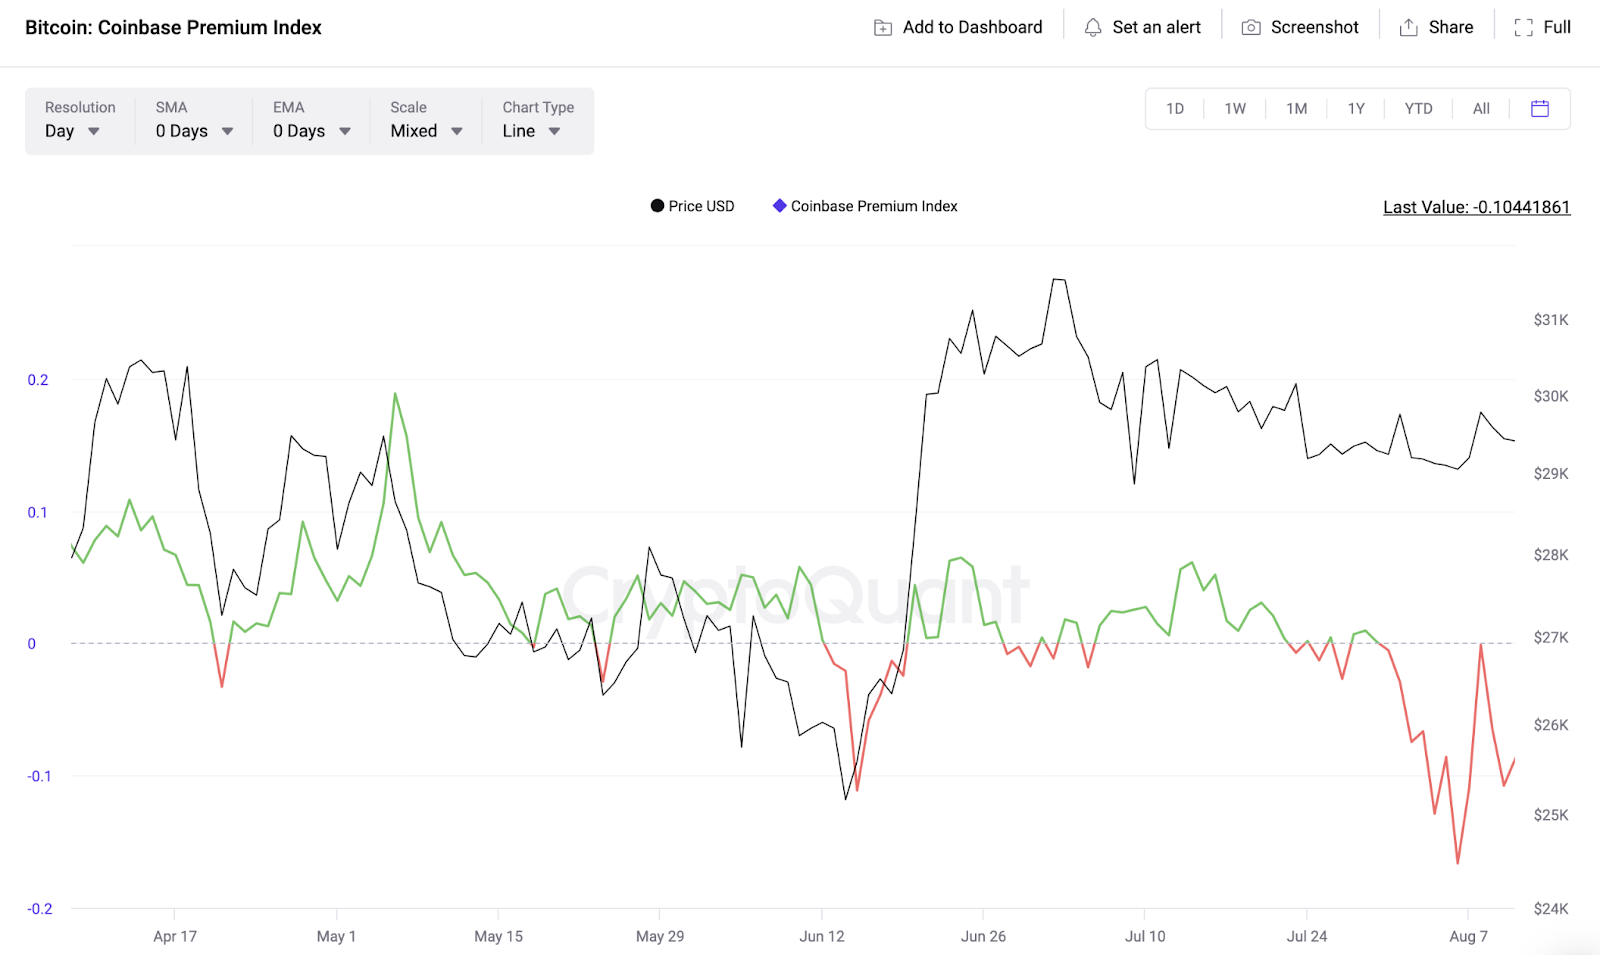
Графиконот погоре покажува дека Coinbase Премиум Индекс has been trending negatively since August. This shows that while the US investors began to bet against the stock market, they also decreased their demand for BTC in August.
Notable Coinbase Pro users in the US include wealthy individuals, publicly-traded firms, and the US government itself. Consequently, their trading patterns often influence BTC prices significantly.
A closer look at the chart above shows that BTC prices often trend upward when the Coinbase Премиум Индекс enters the positive (green) zone.
In conclusion, this lends further credence to the premise that US Stock prices and BTC could head in the same direction in the coming weeks.
BTC Price Prediction: Stock Crash Could Force Downswing to $25,000
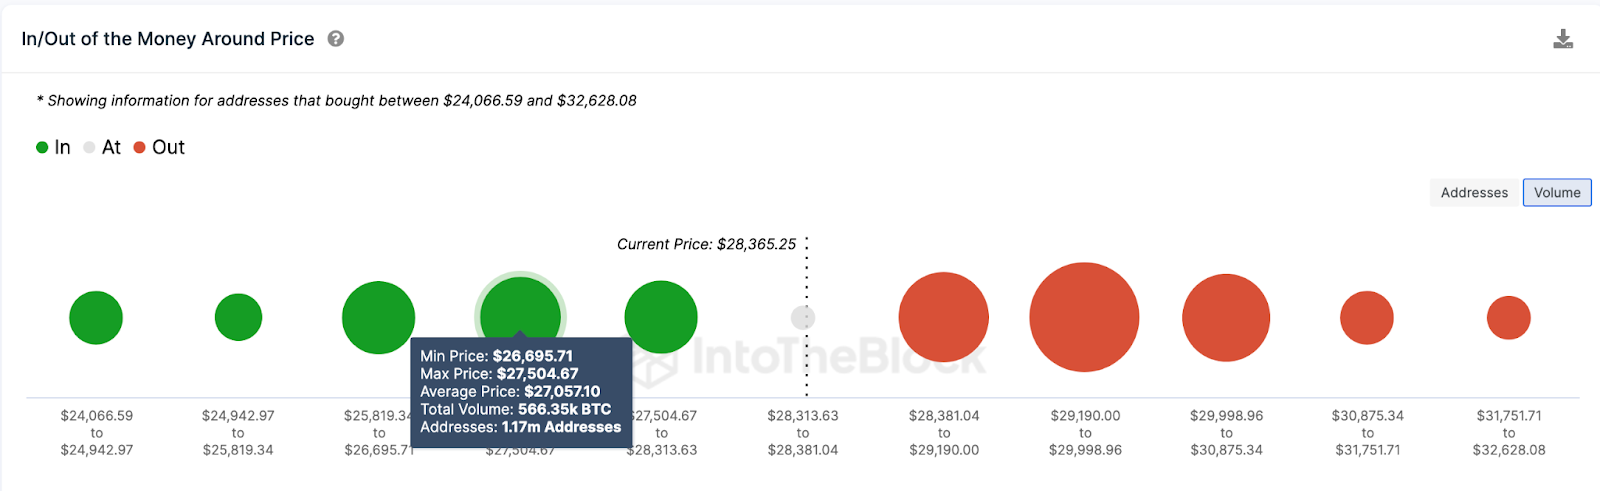
Considering the on-chain data trends analyzed above, a significant downswing in US Stock markets could force BTC into a price downtrend toward $25,000.
However, the 1.17 million addresses had bought 566,350 BTC at the average price of $27,057 will offer initial support. But, if that bearish momentum grows, a panic sell-off could see the BTC price decline toward $25,000.
Conversely, the Bitcoin bulls could potentially stay in control if the BTC price reclaims $31,000. But, as shown above, 2.63 million addresses had bought 1.63 million BTC for an average price of $29,500. They could inadvertently trigger a bearish reversal if they look to book profits.
However, BTC could hit the $31,000 target if that resistance level folds.
Општи услови
Во согласност со упатствата на проектот Trust, оваа статија за анализа на цени е само за информативни цели и не треба да се смета за финансиски или инвестициски совет. BeInCrypto е посветена на точно, непристрасно известување, но пазарните услови се предмет на промена без претходна најава. Секогаш спроведувајте сопствено истражување и консултирајте се со професионалец пред да донесете какви било финансиски одлуки.
Source: https://beincrypto.com/investor-bets-against-stock-market-btc-price-reaction/