- Cosmos begins the week with a false start but the bulls uplift it from the red zone.
- The bears pulled ATOM down from $12.97 to $12.24 on the seventh day of the week.
- If the bulls are strong enough, they could put ATOM back on the parabolic curve.
Космос (АТОМ) was priced at $12.10 when the markets opened for trading this week. Just after a little spike in the green zone, ATOM tanked into the red zone on the first day of the week as shown below. The token receded in the red zone for two days, reaching its lowest price of $11.51. However, in the early hours of the second day, the bulls pulled ATOM into the green zone.
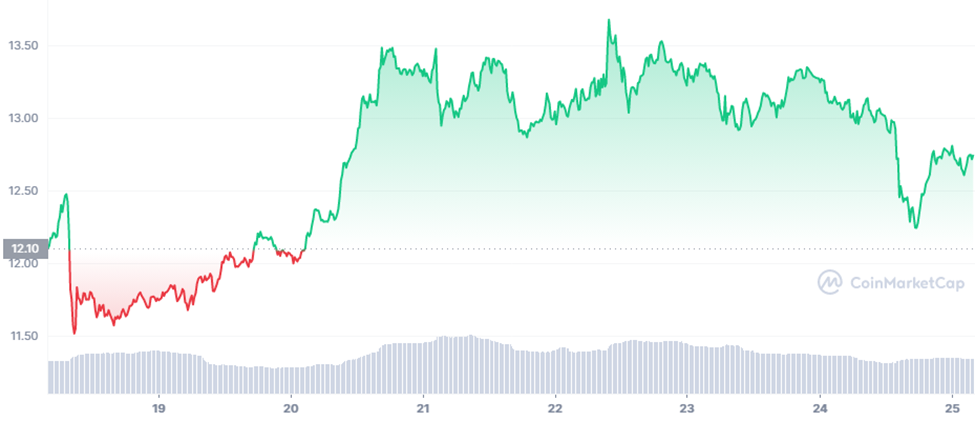
With the help of the bulls, the token was able to fluctuate in the $12.8 – $13.50 range for six days. During its rally, Cosmos reached a maximum price of $13.68 on the fourth day. However, come the seventh day of the week, the bears pulled ATOM down from $12.97 to $12.24 within just a few hours.With some help from the bulls ATOM was able to recover the lost momentum.
Currently, ATOM is down by 2.98% in the last 24 hours and is priced at $12.71, according to CoinMarketCap.

Meanwhile, ATOM has been increasing exponentially taking the form of a parabolic curve as shown in the chart below. Although at the beginning of the curve, ATOM’s vertical movement was restricted within the contracted Bollinger bands, ATOM fluctuated with more amplitude after breaking the 200-day MA while rising along the parabolic line shown in the chart.
Notably, ATOM has been strictly following the Bollinger bands, correcting its price whenever it touched the lower or upper bands. Currently, Cosmos has touched the lower Bollinger band, hence, the market could correct the prices. As such, ATOM could rise again.
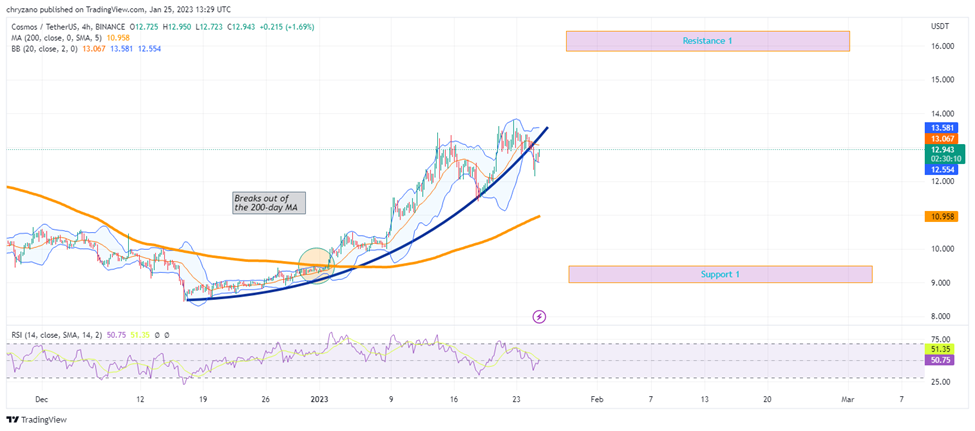
If the preceding is the scenario, buyers may fancy entering the market and it too could give a glimpse of hope to long position traders as the price may increase.
The RSI which is at 50.38 supports the above sentiment. Since it is neither overbought nor oversold there’s potential for the price to move either way. If the bulls take over, ATOM could hit resistance 1. Moreover, if the bulls are too strong and pull ATOM back into the parabolic curve, then the question wouldn’t be “if” ATOM hits the resistance, but it would be “when” it hits.
Contrastingly, if the bears dominate, ATOM will tank to support 1. However, the 200-day MA may intermediate before ATOM reaches support 1.
Општи услови: Ставовите и мислењата, како и сите информации споделени во оваа анализа на цените, се објавени со добра волја. Читателите мора да направат сопствено истражување и длабинска анализа. Секое дејство преземено од читателот е строго на сопствен ризик, Coin Edition и неговите филијали нема да бидат одговорни за каква било директна или индиректна штета или загуба.
Source: https://coinedition.com/cosmos-breaks-out-of-its-parabolic-curve-will-the-bulls-redeem/