
- MINA has formed continuous higher highs and higher lows lately which indicates that it has entered an uptrend.
- Indicators generate a buy signal for coin.
- A Golden Crossover is about to occur on daily chart which may drive prices of the coin higher.
The technical analysts might have observed on daily chart that coin crossed one of its key resistance and showed a bull move. At the present time, MINA has begun to consolidate once again at current price levels. The current price levels are also one of coin’s resistance.
MINA displays a bull rally on daily chart
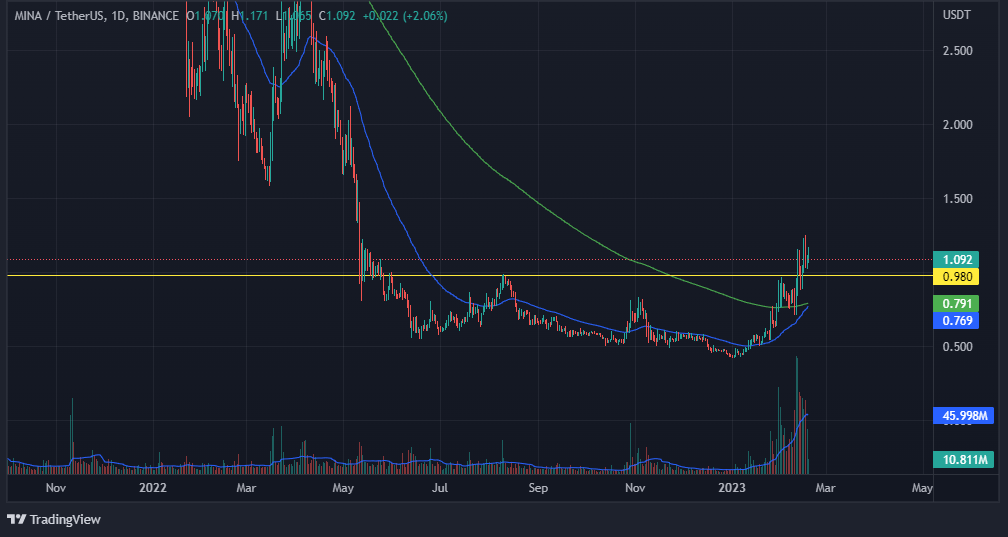
On daily chart, investors can clearly see that coin after making a large downfall, moved in a sideways trend for a long time. They might have also noticed that recently coin showed a great bull rally from is major support level, that is, from around $0.427. During its bull rally, it also crossed one of its key’s resistance. Apart from this, a Golden Crossover is about to occur on the chart. This Golden Crossover may drive prices of the coin even higher.

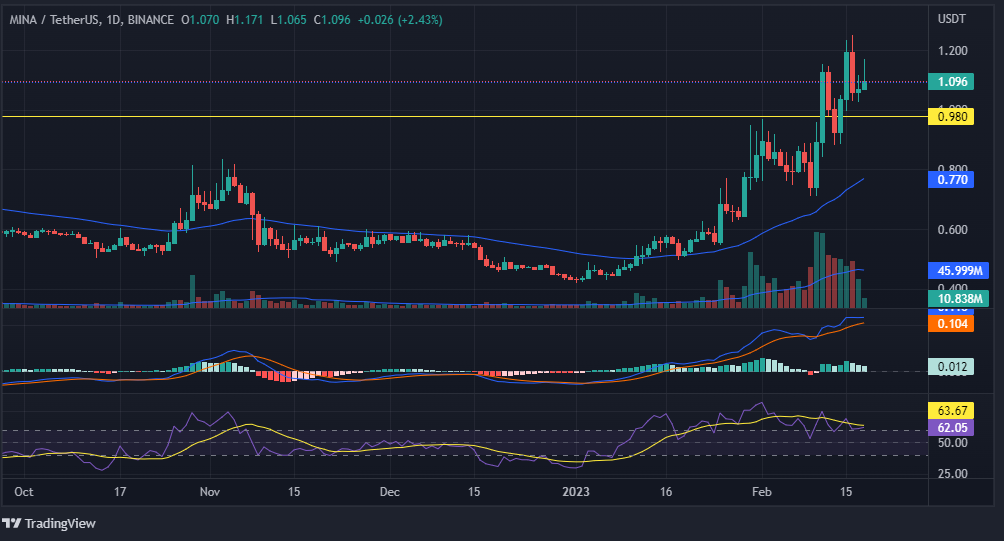
The MACD indicator has displayed a bullish crossover which implies that bulls have increased in number than bears. This crossover also implies that investors may now see an increase in coin’s prices. The RSI curve, on other hand, is trading at 62.05, which is above its 50-point level. RSI curve’s value may be seen increasing even more in future as the price of coin rises.
Thus, it is clearly visible that both the indicators, MACD and RSI are giving a buy signal.
A Golden Crossover is visible on the short-term chart
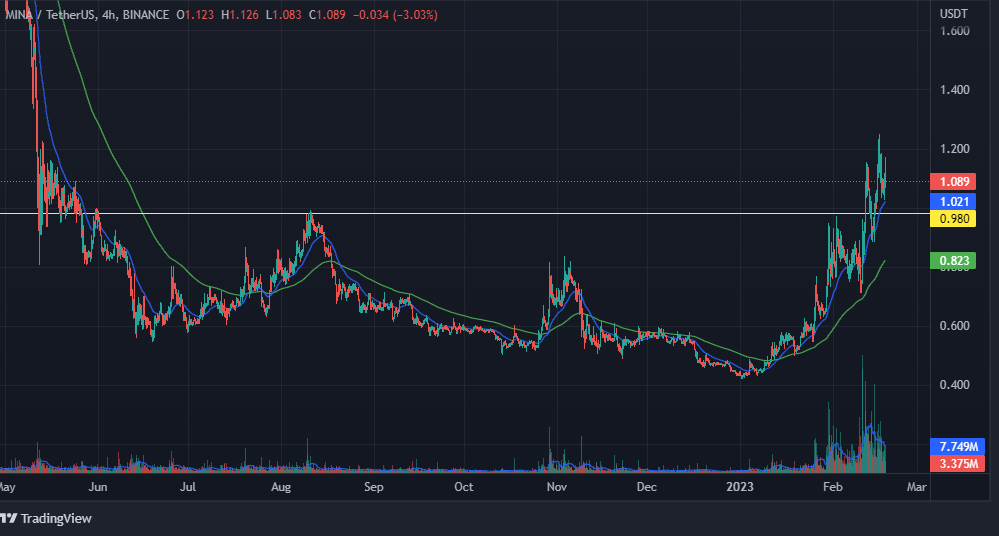
A price movement similar to that of daily chart is visible on short-term chart. On short-term chart as well, investors can see the coin consolidating in a zone. The only difference that is visible on chart is that a Golden Crossover which has not taken place on daily chart has already occurred on short-term chart at the major support level, that is, around $0.427 and this crossover may be one of the reasons of increase in coin price lately.
Заклучок
Investors after having a look at both the charts may have drawn conclusion that coin may consolidate for a little while at current price levels before continuing its bull rally. They also expects that a Golden Crossover may take place on daily chart soon as the price of Мина coin increases.
Технички нивоа
Нивоа на отпор - 1.207 и 2.230 долари
Нивоа на поддршка - 0.606 и 0.427 долари
Општи услови: Ставовите и мислењата наведени од автор, или кои било луѓе именувани во овој напис, се само за информативни цели и не смеат да воспостават финансиски, инвестициски или какви било други финансиски совети. Инвестирањето или тргувањето со крипто средства доаѓа со ризик од финансиска загуба.
Source: https://www.thecoinrepublic.com/2023/02/19/mina-technical-analysis-whats-next-as-coin-crosses-resistance/