The cryptocurrency market is still in a state of uncertainty and fear. Ethereum is no exception, and any upward attempt is faced with immediate sell pressure. Will the bulls be able to regain control of the market?
Техничка анализа
By гризли
Дневниот графикон
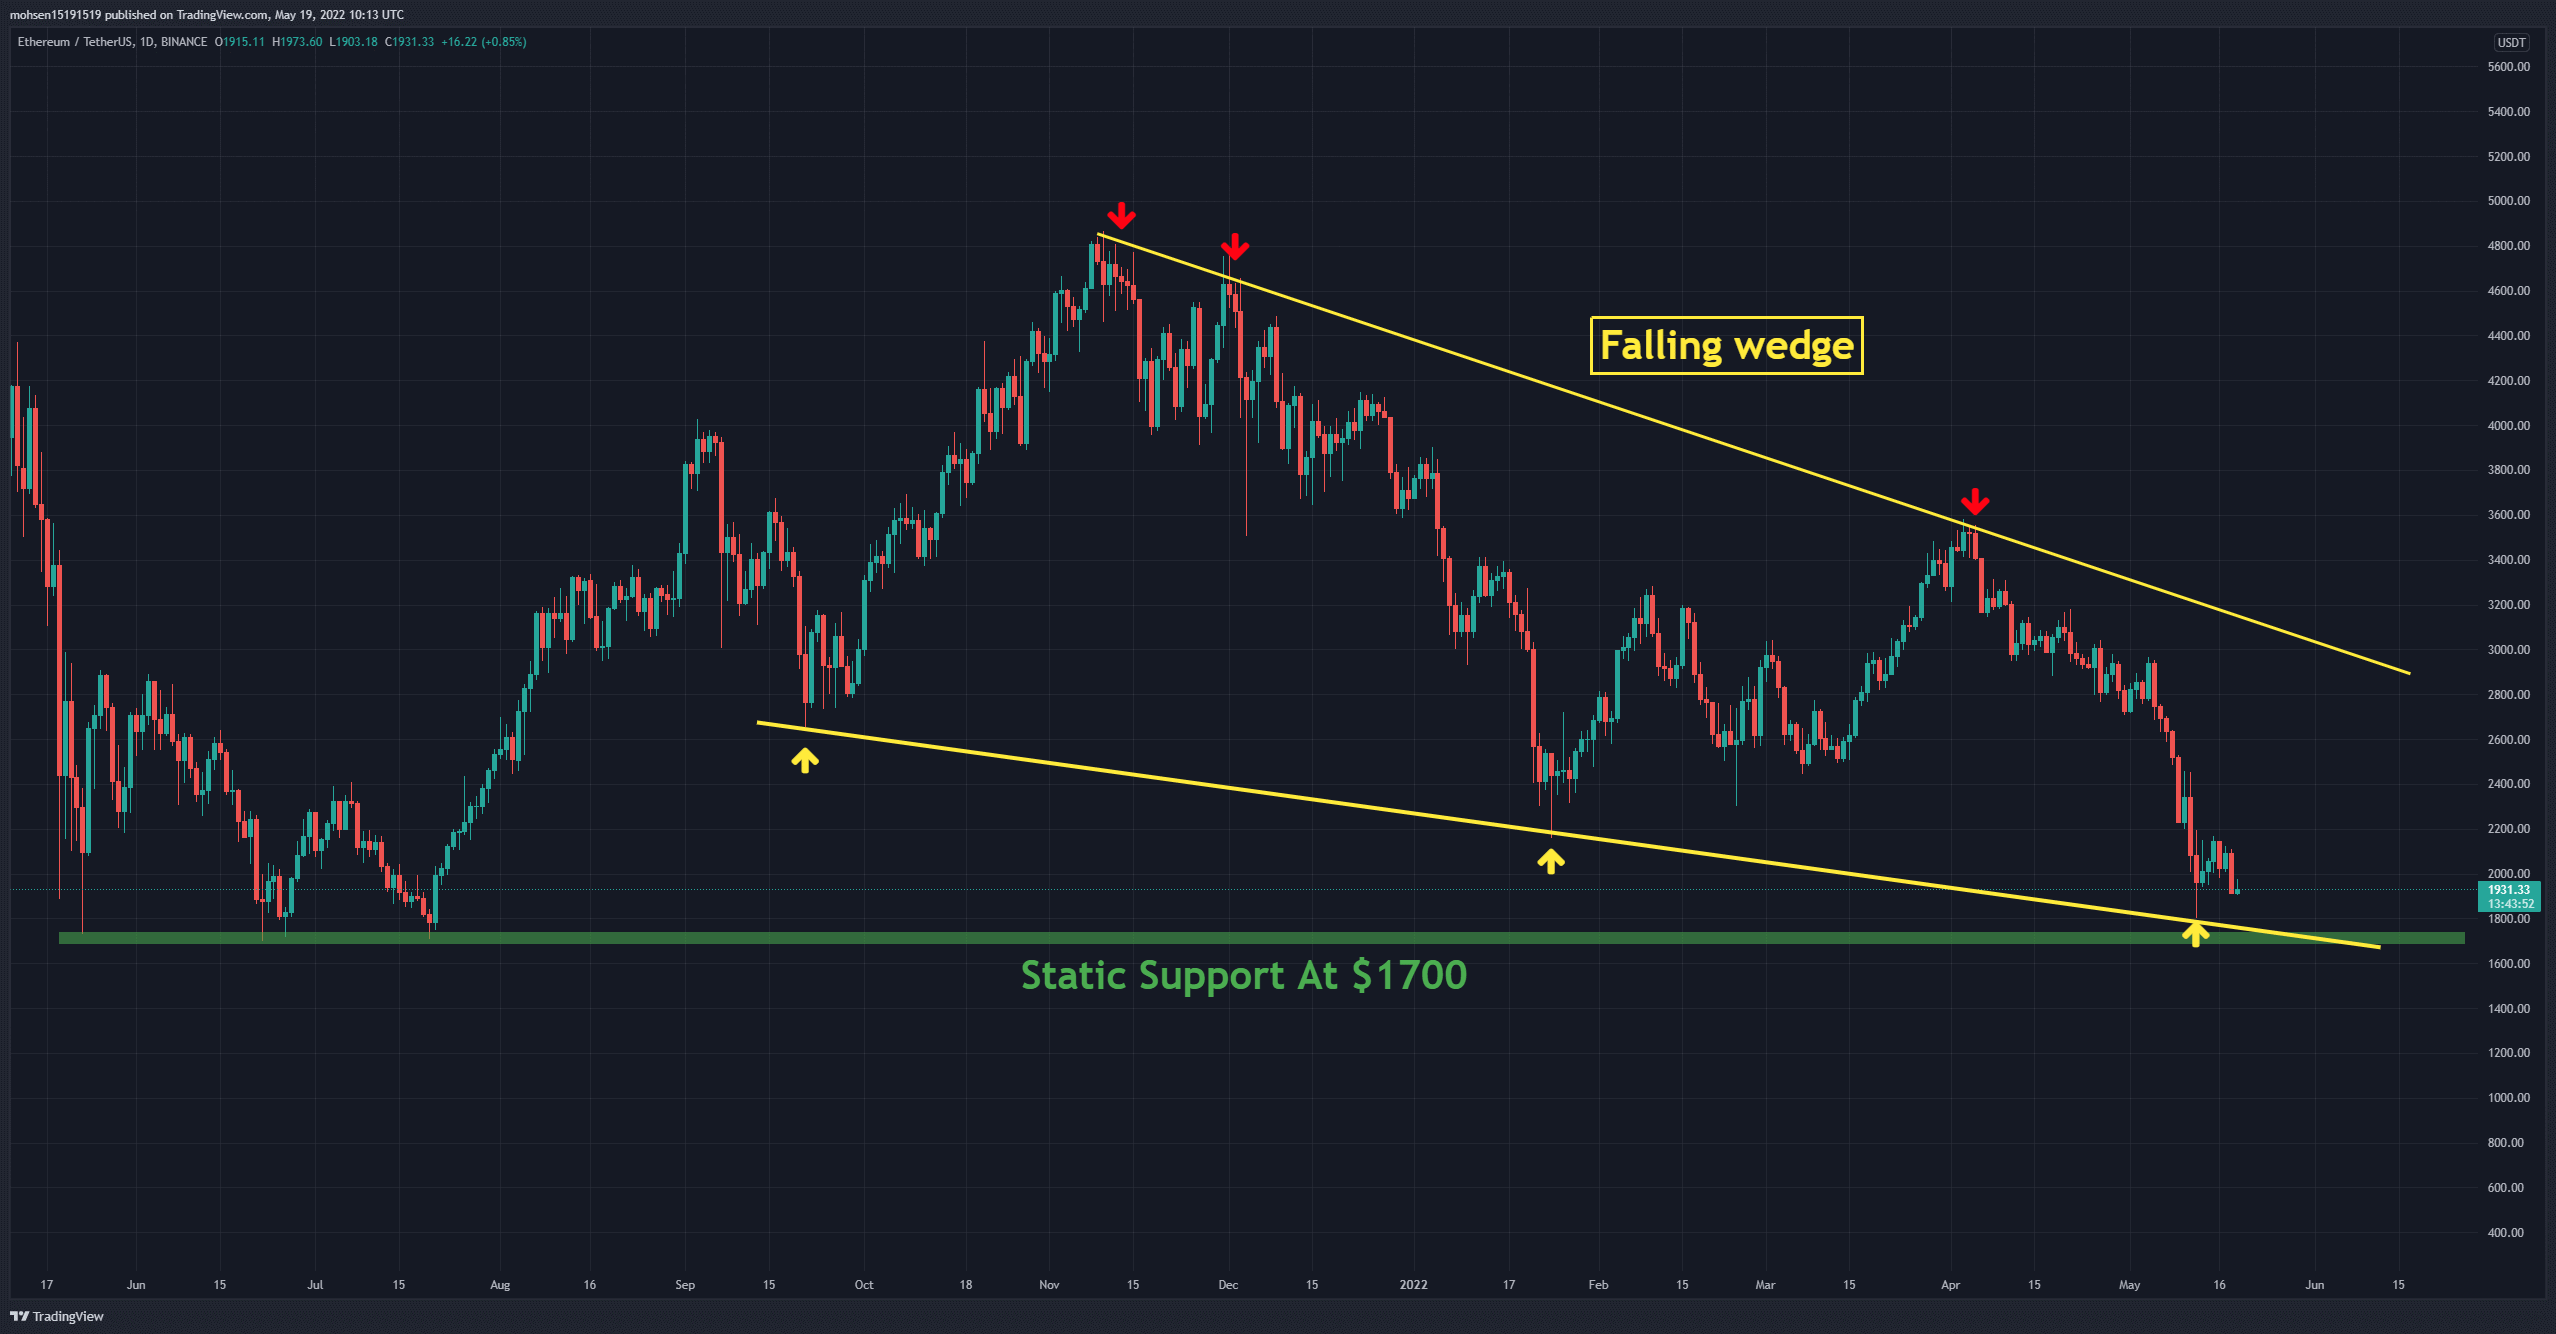
On the daily time frame, ETH is moving downward inside a falling wedge (in yellow). It is important to note that this wedge bottom is aligned with the horizontal support level of $1700 (in green), which can be a potential trend reversal point.
As a result, if the bulls can defend the green zone, the price will be more likely to move towards the static resistance at $2450. On the other hand, if the bears continue to suppress the market and break below the green support zone, the price is more likely to enter an extended regression phase.
Клучни нивоа на поддршка: 1700 и 1500 долари
Клучни нивоа на отпорност: 2200 и 2450 долари
Подвижни просеци:
MA20: 2376 долари
MA50: 2818 долари
MA100: 2835 долари
MA200: 3301 долари
Табела ETH/BTC
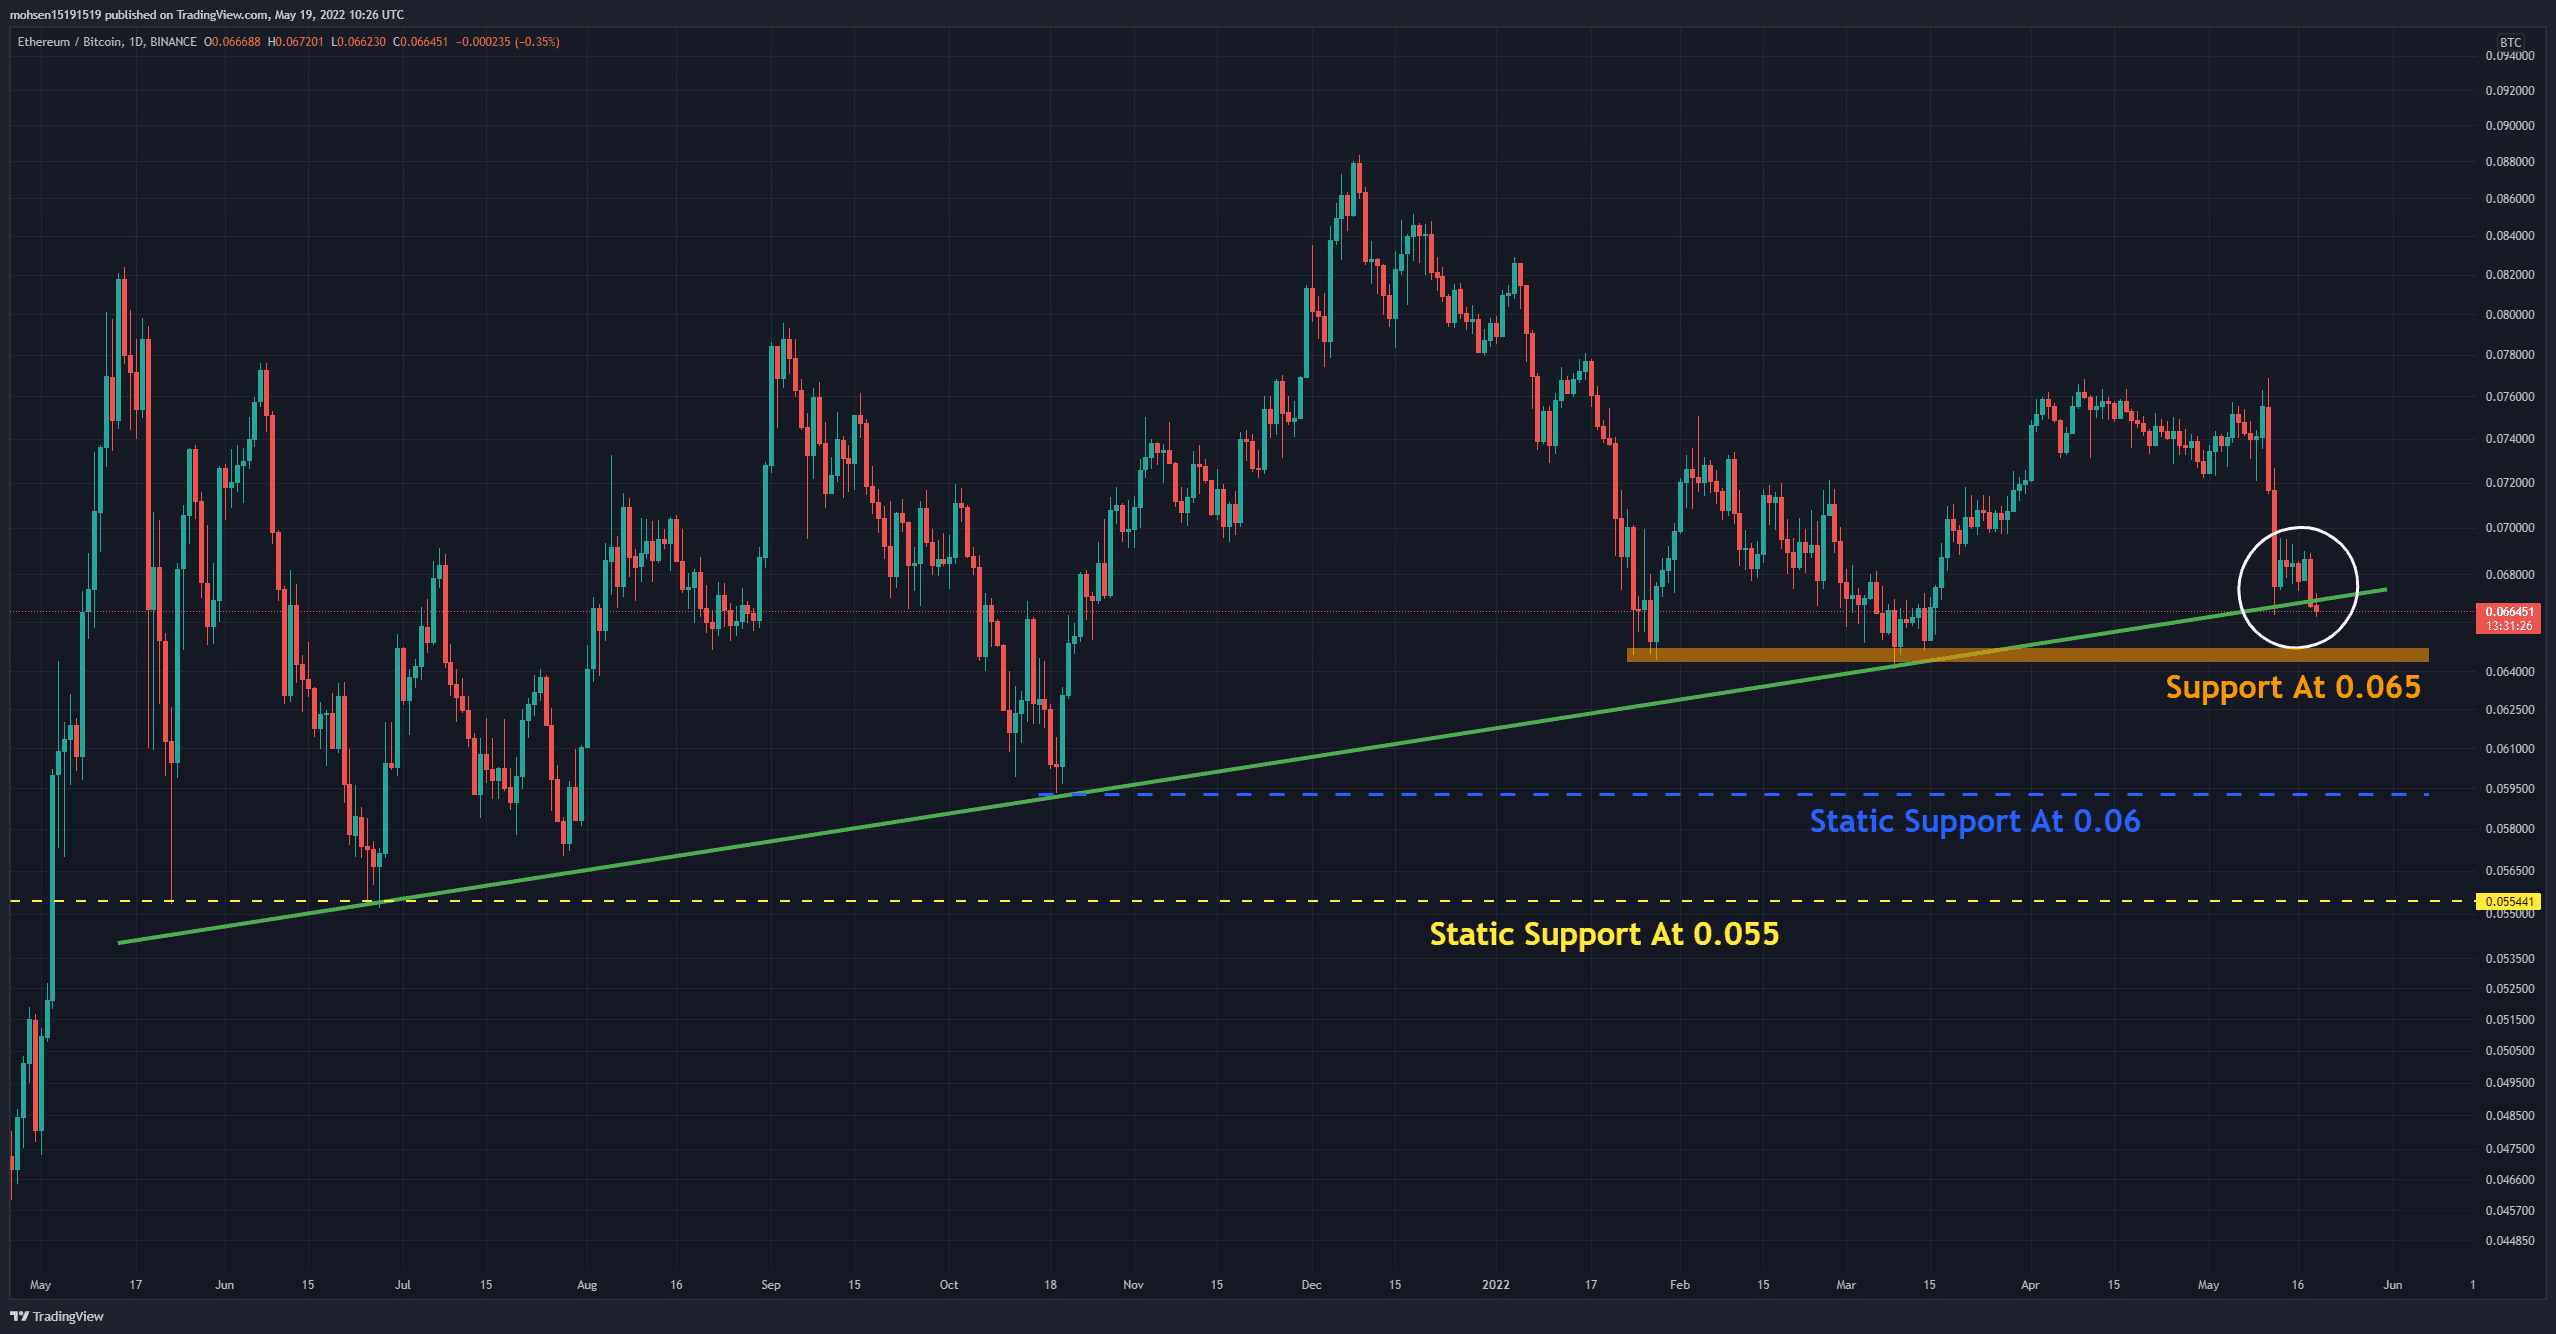
Against Bitcoin, ETH is trading on dynamic support (in green) that has prevented further drops in price four times in the past. The main concern is that the bears have managed to make an unconfirmed break and appear to be in control of the situation. On the other hand, horizontal support at 0.065 (in orange) can also be considered a level to withstand the increasing bearish momentum.
If the BTC price breaks below a major static level, the entire altcoin market is historically proven to follow with an amplified correction.
Клучни нивоа на поддршка: 0.065 БТК и 0.06 БТК
Клучни нивоа на отпорност: 0.07 БТК и 0.072 БТК
Анализа на синџир
Проценет сооднос на потпора
Дефиниција: The exchange’s open interest is divided by their coins reserve, which shows how much leverage traders use on average. Increasing values indicate more investors are taking high leverage risk in the derivatives trade.
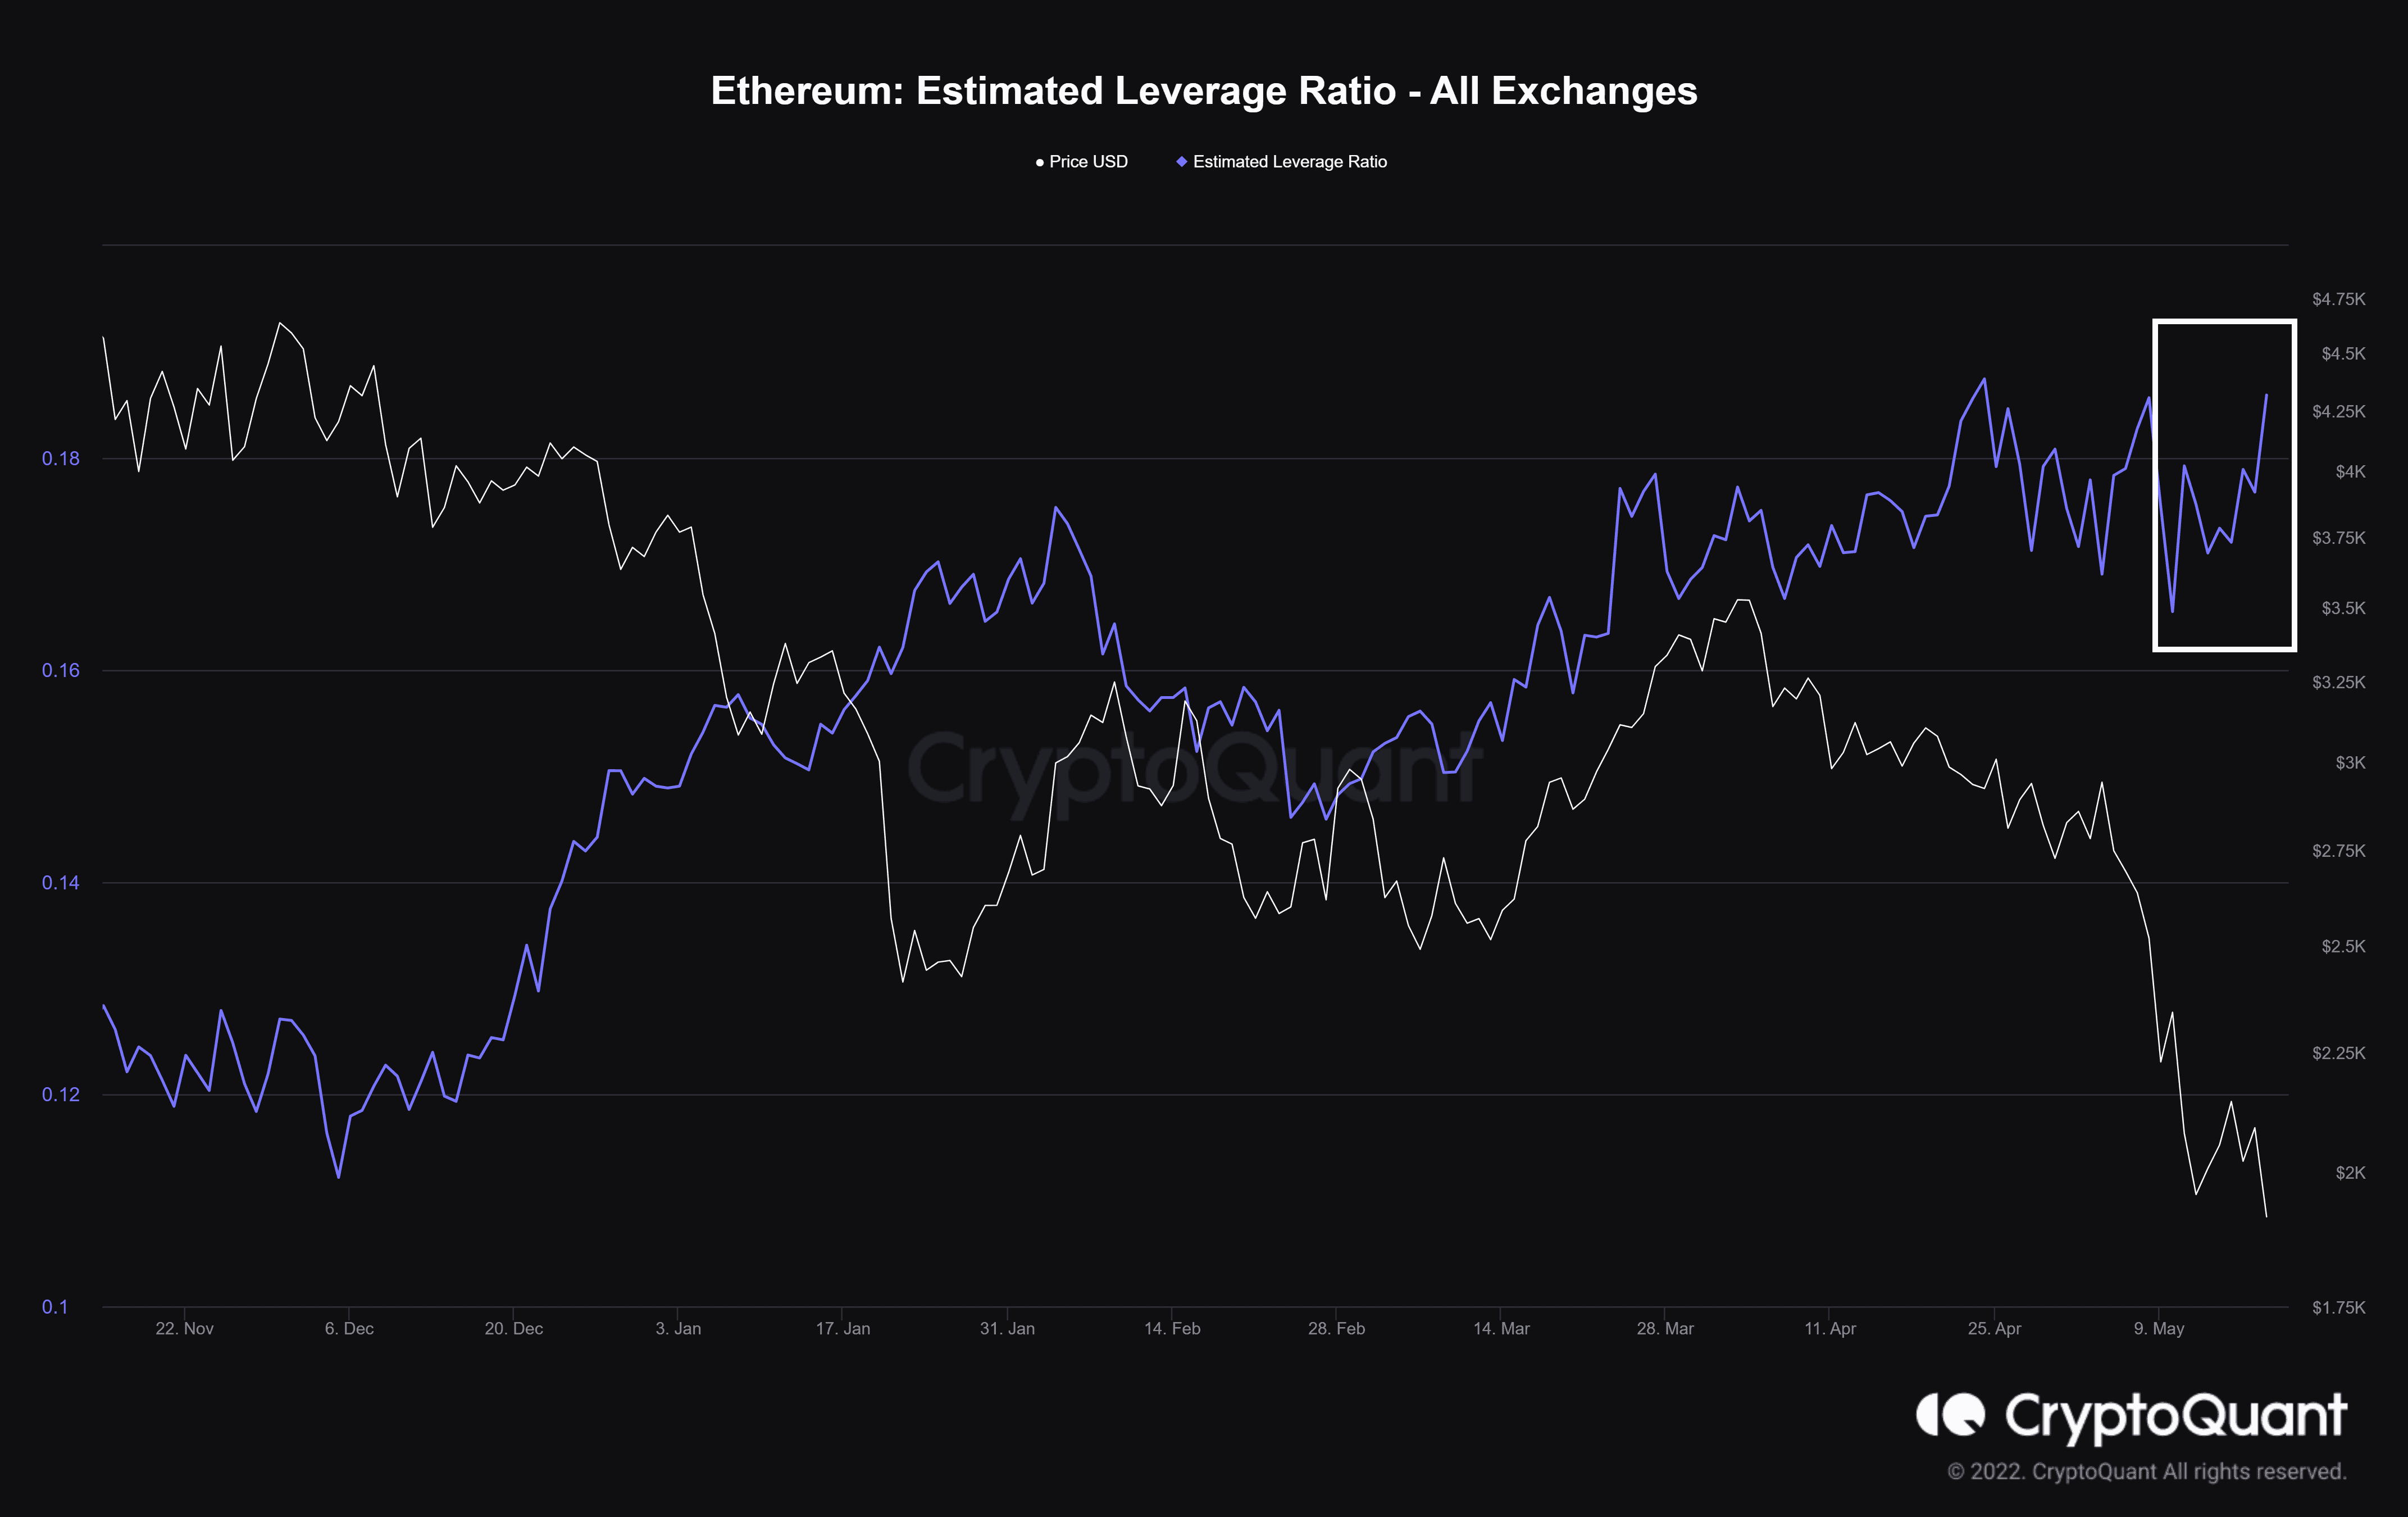
On the chart, one can see that this metric has started moving upwards again, indicating that investors are taking more risks. The consequent outcome is probably significant volatility and then a cascade of liquidations. After all, throughout a bearish phase, a de-leveraging phase has frequently led to a bullish trend in the market.
Binance Free 100 $ (ексклузивно): Користете ја оваа врска да се регистрирате и да добиете бесплатни $100 и 10% попуст на таксите на Binance Futures првиот месец (услови).
PrimeXBT Специјална понуда: Користете ја оваа врска да се регистрирате и да го внесете кодот POTATO50 за да добиете до 7,000 УСД на вашите депозити.
Одрекување: Информациите пронајдени на CryptoPotato се оние на цитираните писатели. Не ги претставува мислењата на CryptoPotato за тоа дали да купи, продаде или да одржи инвестиции. Ве советуваме да спроведете свое истражување пред да донесете какви било решенија за инвестирање. Користете дадени информации на ваш сопствен ризик. Погледнете Одрекување за повеќе информации.
Табели за криптовалентност од TradingView.
Source: https://cryptopotato.com/eth-price-analysis-warning-signs-for-ethereum-as-bears-push-below-2000/